Cars: a source of exclusion?


Economy, stupid. This now-famous sentence was written in 1992 by future President Bill Clinton’s advisor James Carville, on a sign at their campaign headquarters in Little Rock. Looking at the results of this survey, his words seem more relevant than ever.
Cars are expensive to buy, they are expensive to use, and this cost is becoming prohibitive for motorists, with many now fearful of being left by the wayside. While it is true that the inevitable and legally mandated development of electric vehicles points to a brighter future, manufacturers must avoid making the stupid mistake of ignoring what customers are saying about prices.
Motorists are pessimistic about the future
The fear of a carless future
If cars are a source of financial pressure today, they are a cause for real concern about tomorrow, that’s if the testimonies gathered for this 2023 edition of L’Observatoire Cetelem are to be believed. 6 out of 10 respondents say they fear that they will no longer be able to afford to own a car in the future (Fig 47). We have seen how gloomy the Turks currently feel about day-to-day life, and they are equally dejected when they think about what awaits them. 85% share this fear of having to live without a car. The Mexicans, Portuguese, Brazilians and South Africans also feel pessimistic. The Netherlands is the only country where the majority are not of this view (49%). Italy and China post similar scores.
Youth appears to be a significant factor when it comes to anticipating a potentially car-free life, with a gap of 10 points forming between the under-35s and over-35s (67% vs. 57%). Some nations go against the tide, with over-35s displaying greater pessimism than their juniors. This is the case in Turkey, once again, where 92% of over-35s fear that they will no longer be able to own a car, but also in China, South Africa, Poland and Portugal.
Fig 47 – Fear of losing ability to afford a car
Download this infographic for your presentations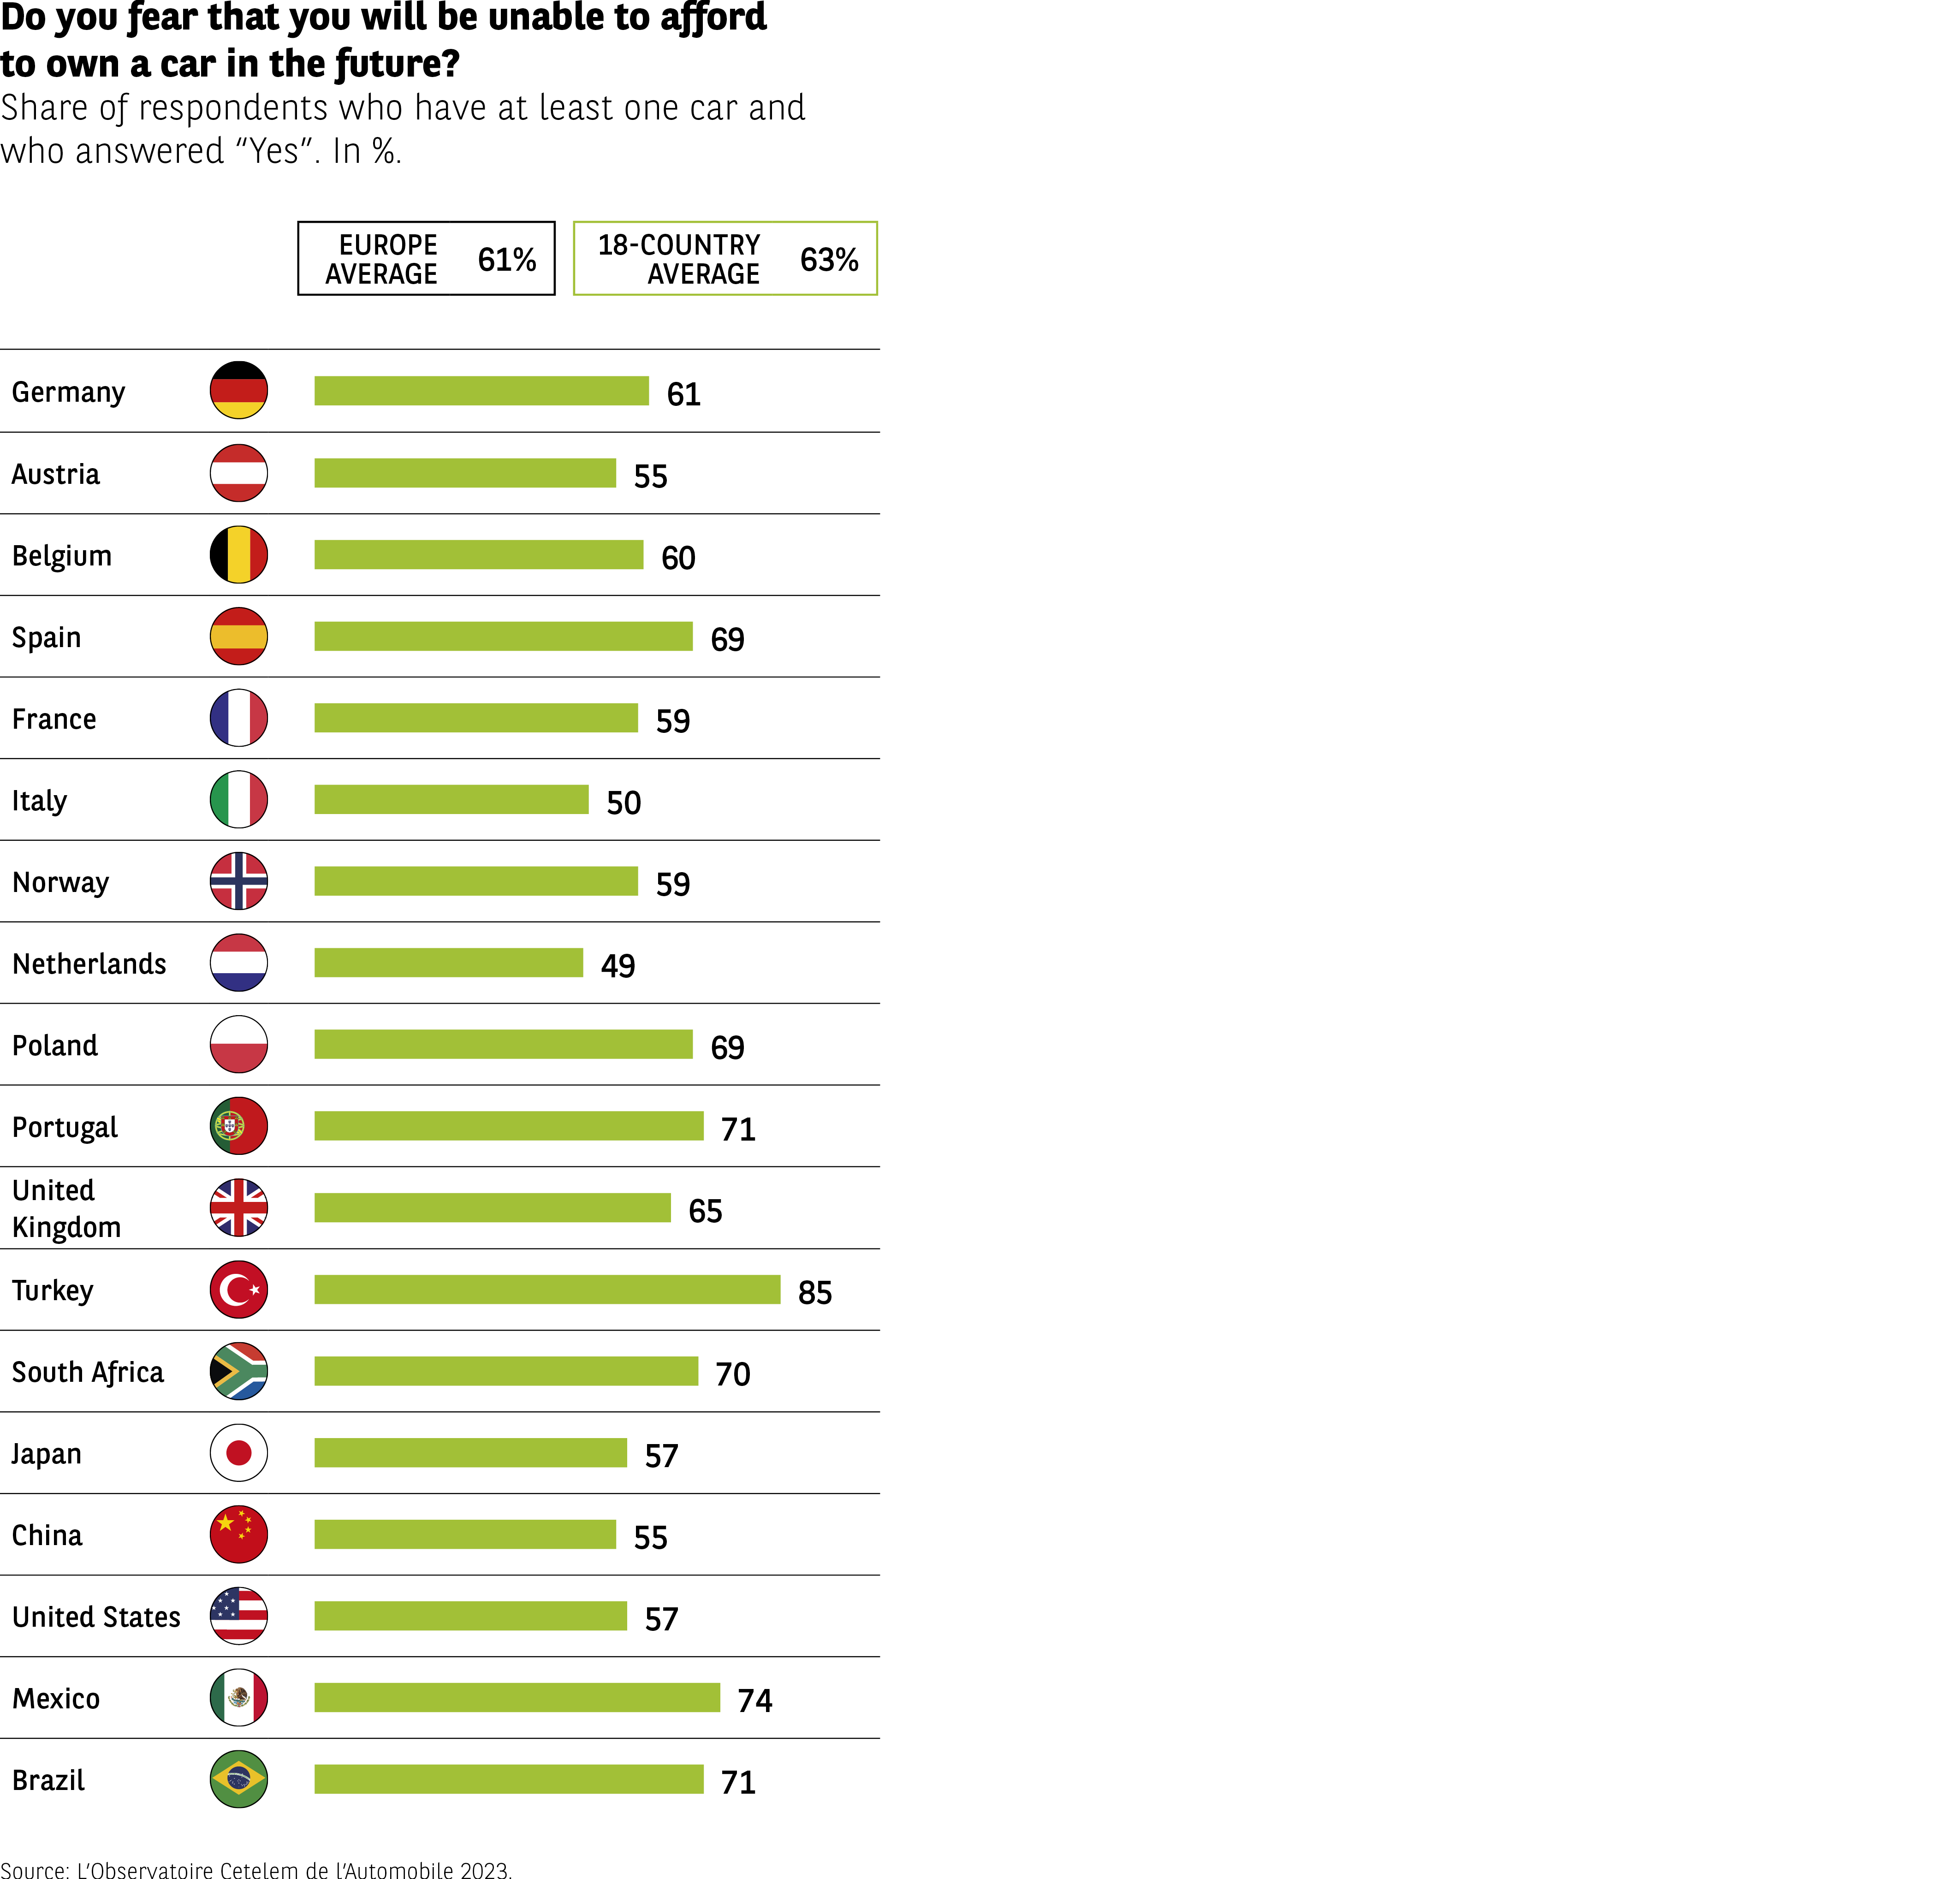 The infographic indicates the percentage of car owners who fear they may one day no longer be able to afford owning a vehicle.
Averages:
– Europe: 61%
– 18-country average: 63%
Countries (in %):
Germany 61%
Austria 55%
Belgium 60%
Spain 69%
France 59%
Italy 50%
Norway 59%
Netherlands 49%
Poland 69%
Portugal 71%
United Kingdom 65%
Turkey 85%
South Africa 70%
Japan 57%
China 55%
United States 57%
Mexico 74%
Brazil 71%
Most countries show a high level of concern, with particularly high levels in Turkey, Mexico, and Portugal.
Source: Observatoire Cetelem de l’Automobile 2023.
The infographic indicates the percentage of car owners who fear they may one day no longer be able to afford owning a vehicle.
Averages:
– Europe: 61%
– 18-country average: 63%
Countries (in %):
Germany 61%
Austria 55%
Belgium 60%
Spain 69%
France 59%
Italy 50%
Norway 59%
Netherlands 49%
Poland 69%
Portugal 71%
United Kingdom 65%
Turkey 85%
South Africa 70%
Japan 57%
China 55%
United States 57%
Mexico 74%
Brazil 71%
Most countries show a high level of concern, with particularly high levels in Turkey, Mexico, and Portugal.
Source: Observatoire Cetelem de l’Automobile 2023.
It used to be easier
When asked to think about the past, motorists express a degree of nostalgia and envy towards their parents. More of them believe that it is more difficult to own a car today than it was in the past (42% vs. 32%). The Turks, South Africans and Italians are the most likely to miss those “good old days”. In contrast, the Chinese, who are relatively new to motoring, are decidedly positive about the present. Theirs is the only country in which a very broad majority believe that owning a car is easier today (Fig 48).
Fig 48 – Perceived difficulty of affording a car
Download this infographic for your presentations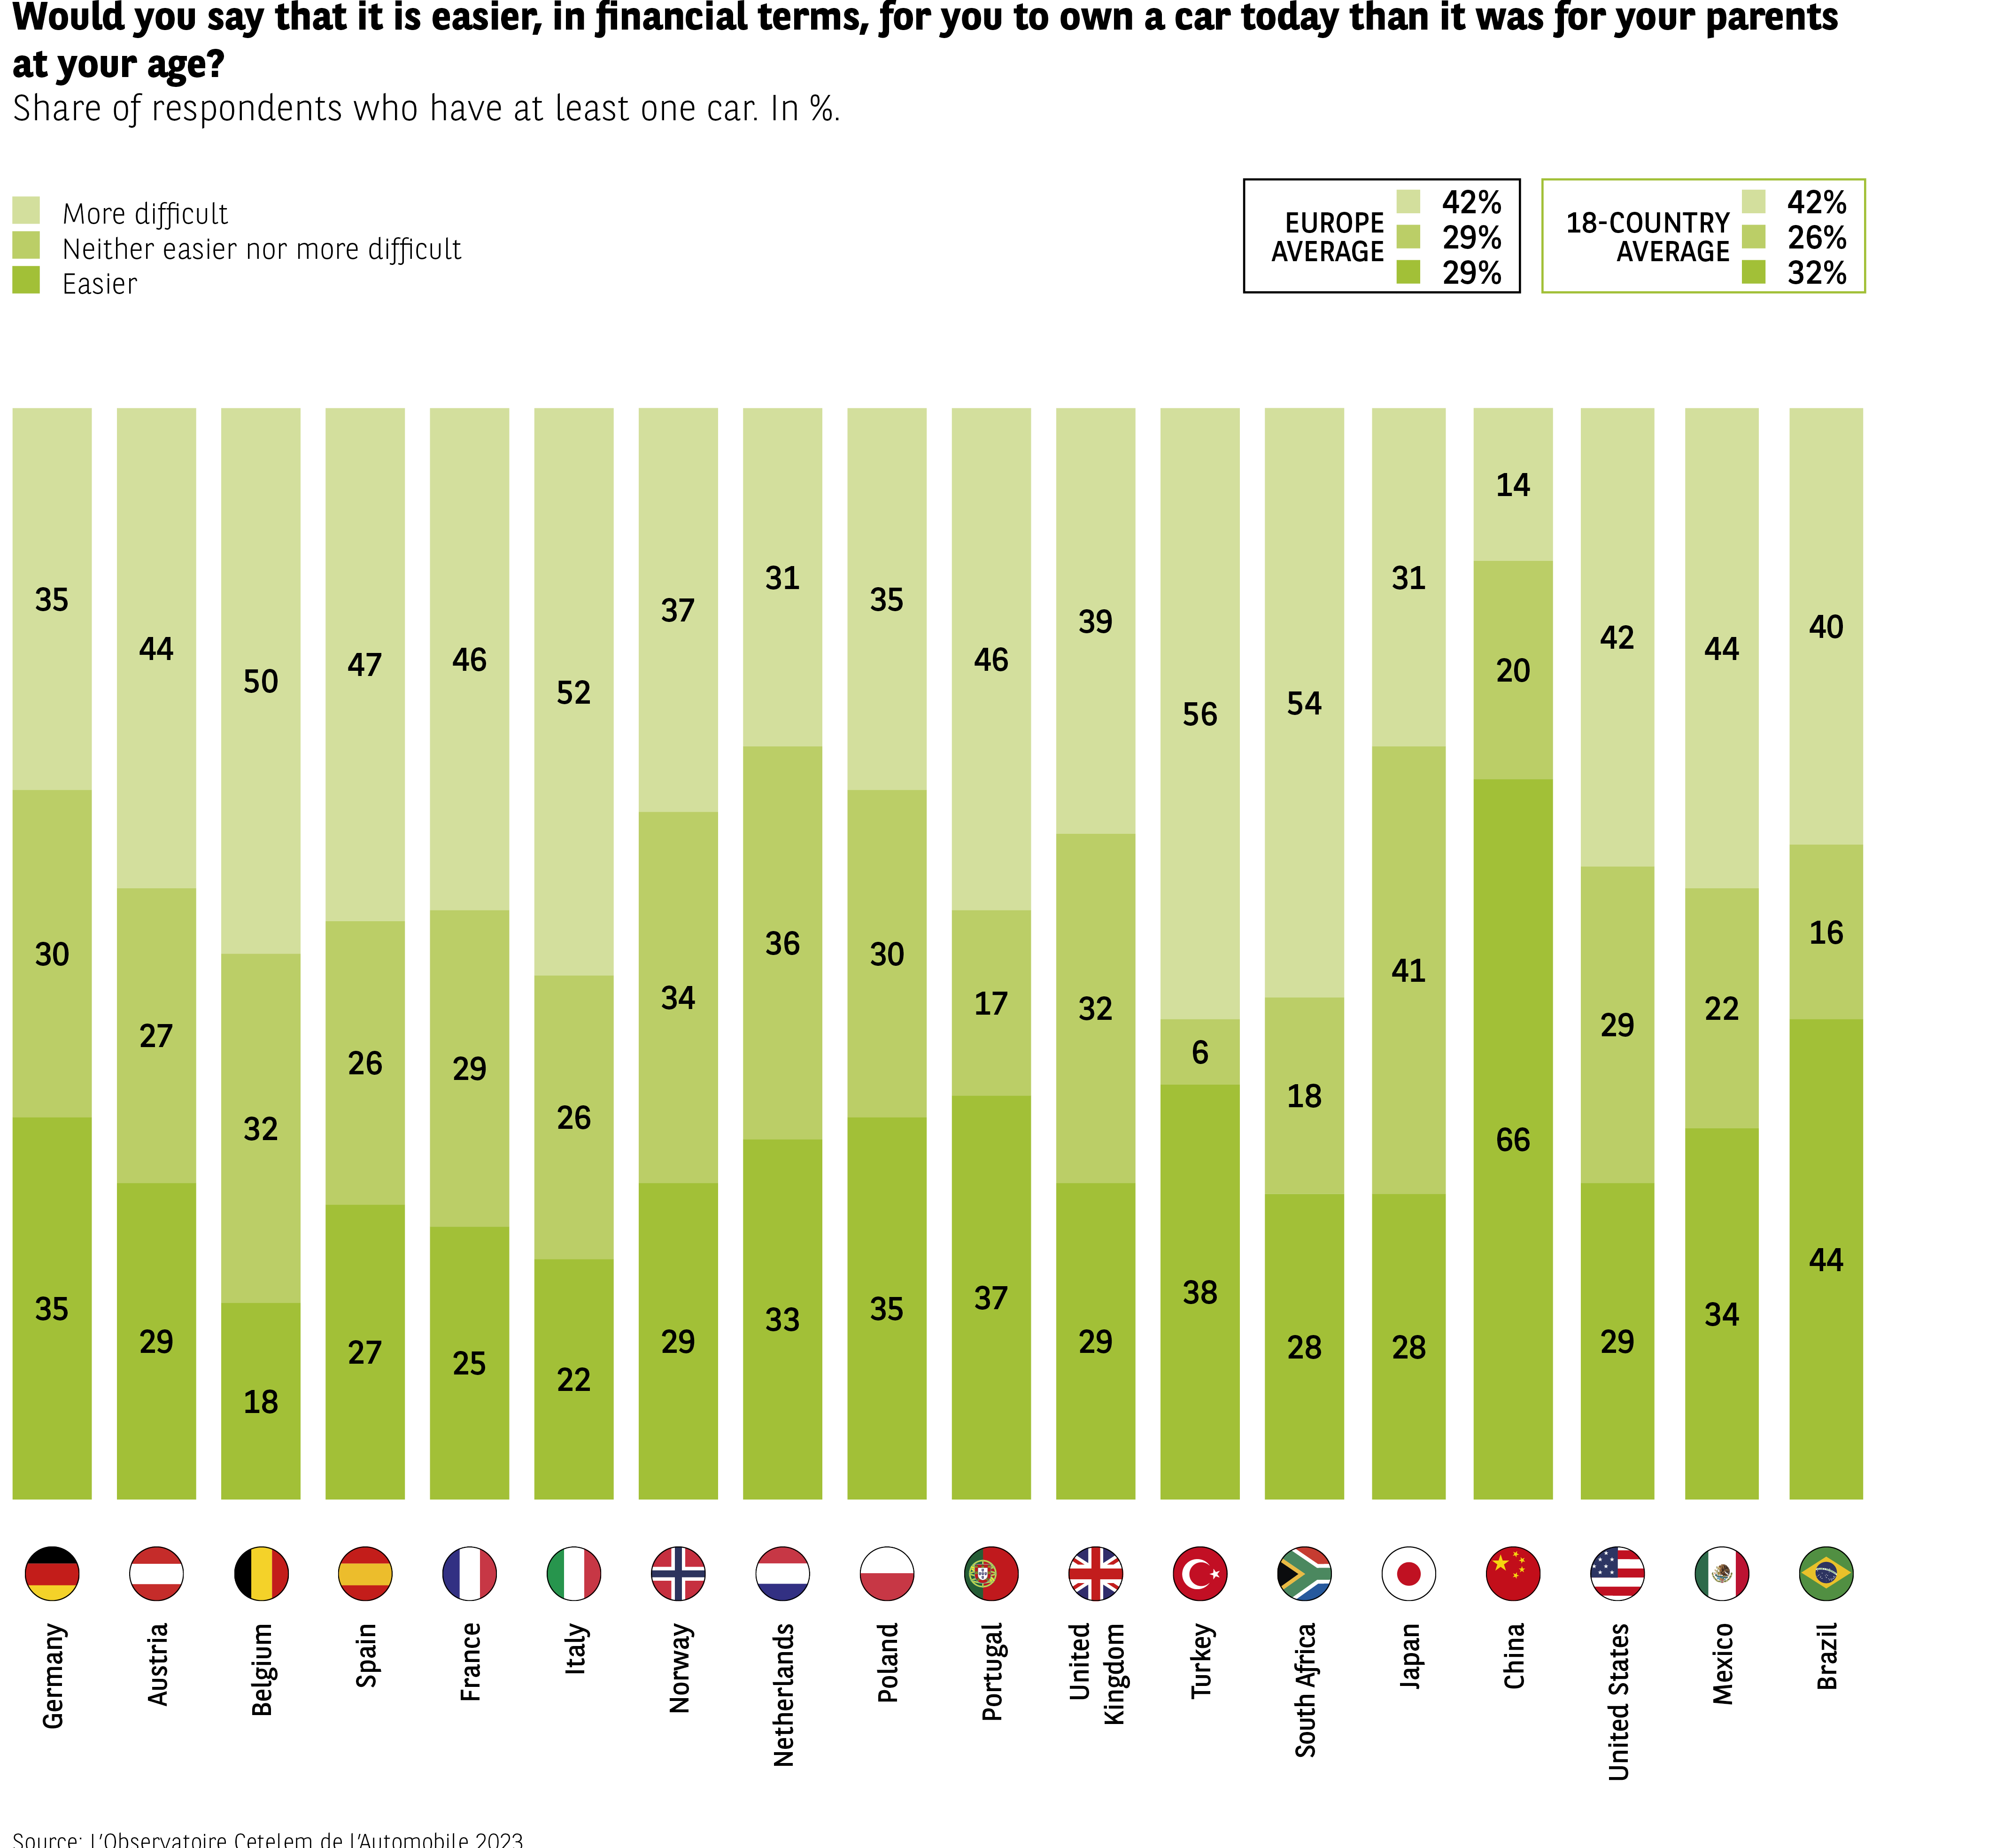 The infographic shows the share of respondents who say it is financially easier, the same, or harder for them to own a car compared with their parents at the same age.
Averages (harder, same, easier):
– Europe: 42%, 29%, 29%
– 18-country average: 42%, 26%, 32%
Countries (in %):
Germany 35 / 30 / 35
Austria 44 / 27 / 29
Belgium 50 / 32 / 18
Spain 47 / 26 / 27
France 46 / 29 / 25
Italy 52 / 26 / 22
Norway 37 / 34 / 29
Netherlands 31 / 36 / 33
Poland 35 / 30 / 35
Portugal 39 / 17 / 37
United Kingdom 46 / 32 / 29
Turkey 56 / 6 / 38
South Africa 54 / 18 / 28
Japan 31 / 41 / 28
China 14 / 66 / 20
United States 42 / 29 / 29
Mexico 44 / 22 / 34
Brazil 40 / 16 / 44
A majority in most countries reports greater financial difficulty, except in China where most respondents feel conditions are similar to their parents’.
Source: Observatoire Cetelem de l’Automobile 2023.
The infographic shows the share of respondents who say it is financially easier, the same, or harder for them to own a car compared with their parents at the same age.
Averages (harder, same, easier):
– Europe: 42%, 29%, 29%
– 18-country average: 42%, 26%, 32%
Countries (in %):
Germany 35 / 30 / 35
Austria 44 / 27 / 29
Belgium 50 / 32 / 18
Spain 47 / 26 / 27
France 46 / 29 / 25
Italy 52 / 26 / 22
Norway 37 / 34 / 29
Netherlands 31 / 36 / 33
Poland 35 / 30 / 35
Portugal 39 / 17 / 37
United Kingdom 46 / 32 / 29
Turkey 56 / 6 / 38
South Africa 54 / 18 / 28
Japan 31 / 41 / 28
China 14 / 66 / 20
United States 42 / 29 / 29
Mexico 44 / 22 / 34
Brazil 40 / 16 / 44
A majority in most countries reports greater financial difficulty, except in China where most respondents feel conditions are similar to their parents’.
Source: Observatoire Cetelem de l’Automobile 2023.
The age effect
There is data to show that the age of car buyers is on the increase. The average age of new-car buyers in France in 1990 was 44. Today, the figure is 55. By way of comparison, the average age is 53 in Europe overall, 52 in Germany and 46 in Spain. This rising figure is due in part to the fact that young urban populations are now less dependent on cars for their daily travel needs.
Are cars passé?
Some signs suggest that people are already moving away from car ownership. Nearly 4 out of 10 people who do not own a car today did own one in the past (Fig 49). This shift away from the automobile is more marked in European and Western countries. This even describes the majority of such individuals in the US, Spain, Austria and Italy. In contrast, only a very small percentage of Chinese and South Africans are in this position. It should also be noted that the global rural/urban breakdown is not as clear cut here as it is on other topics. In seven of the countries surveyed, there are more rural than urban-based non-car owners who formerly had a vehicle.
Fig 49 – Share of people who previously owned a car
Download this infographic for your presentations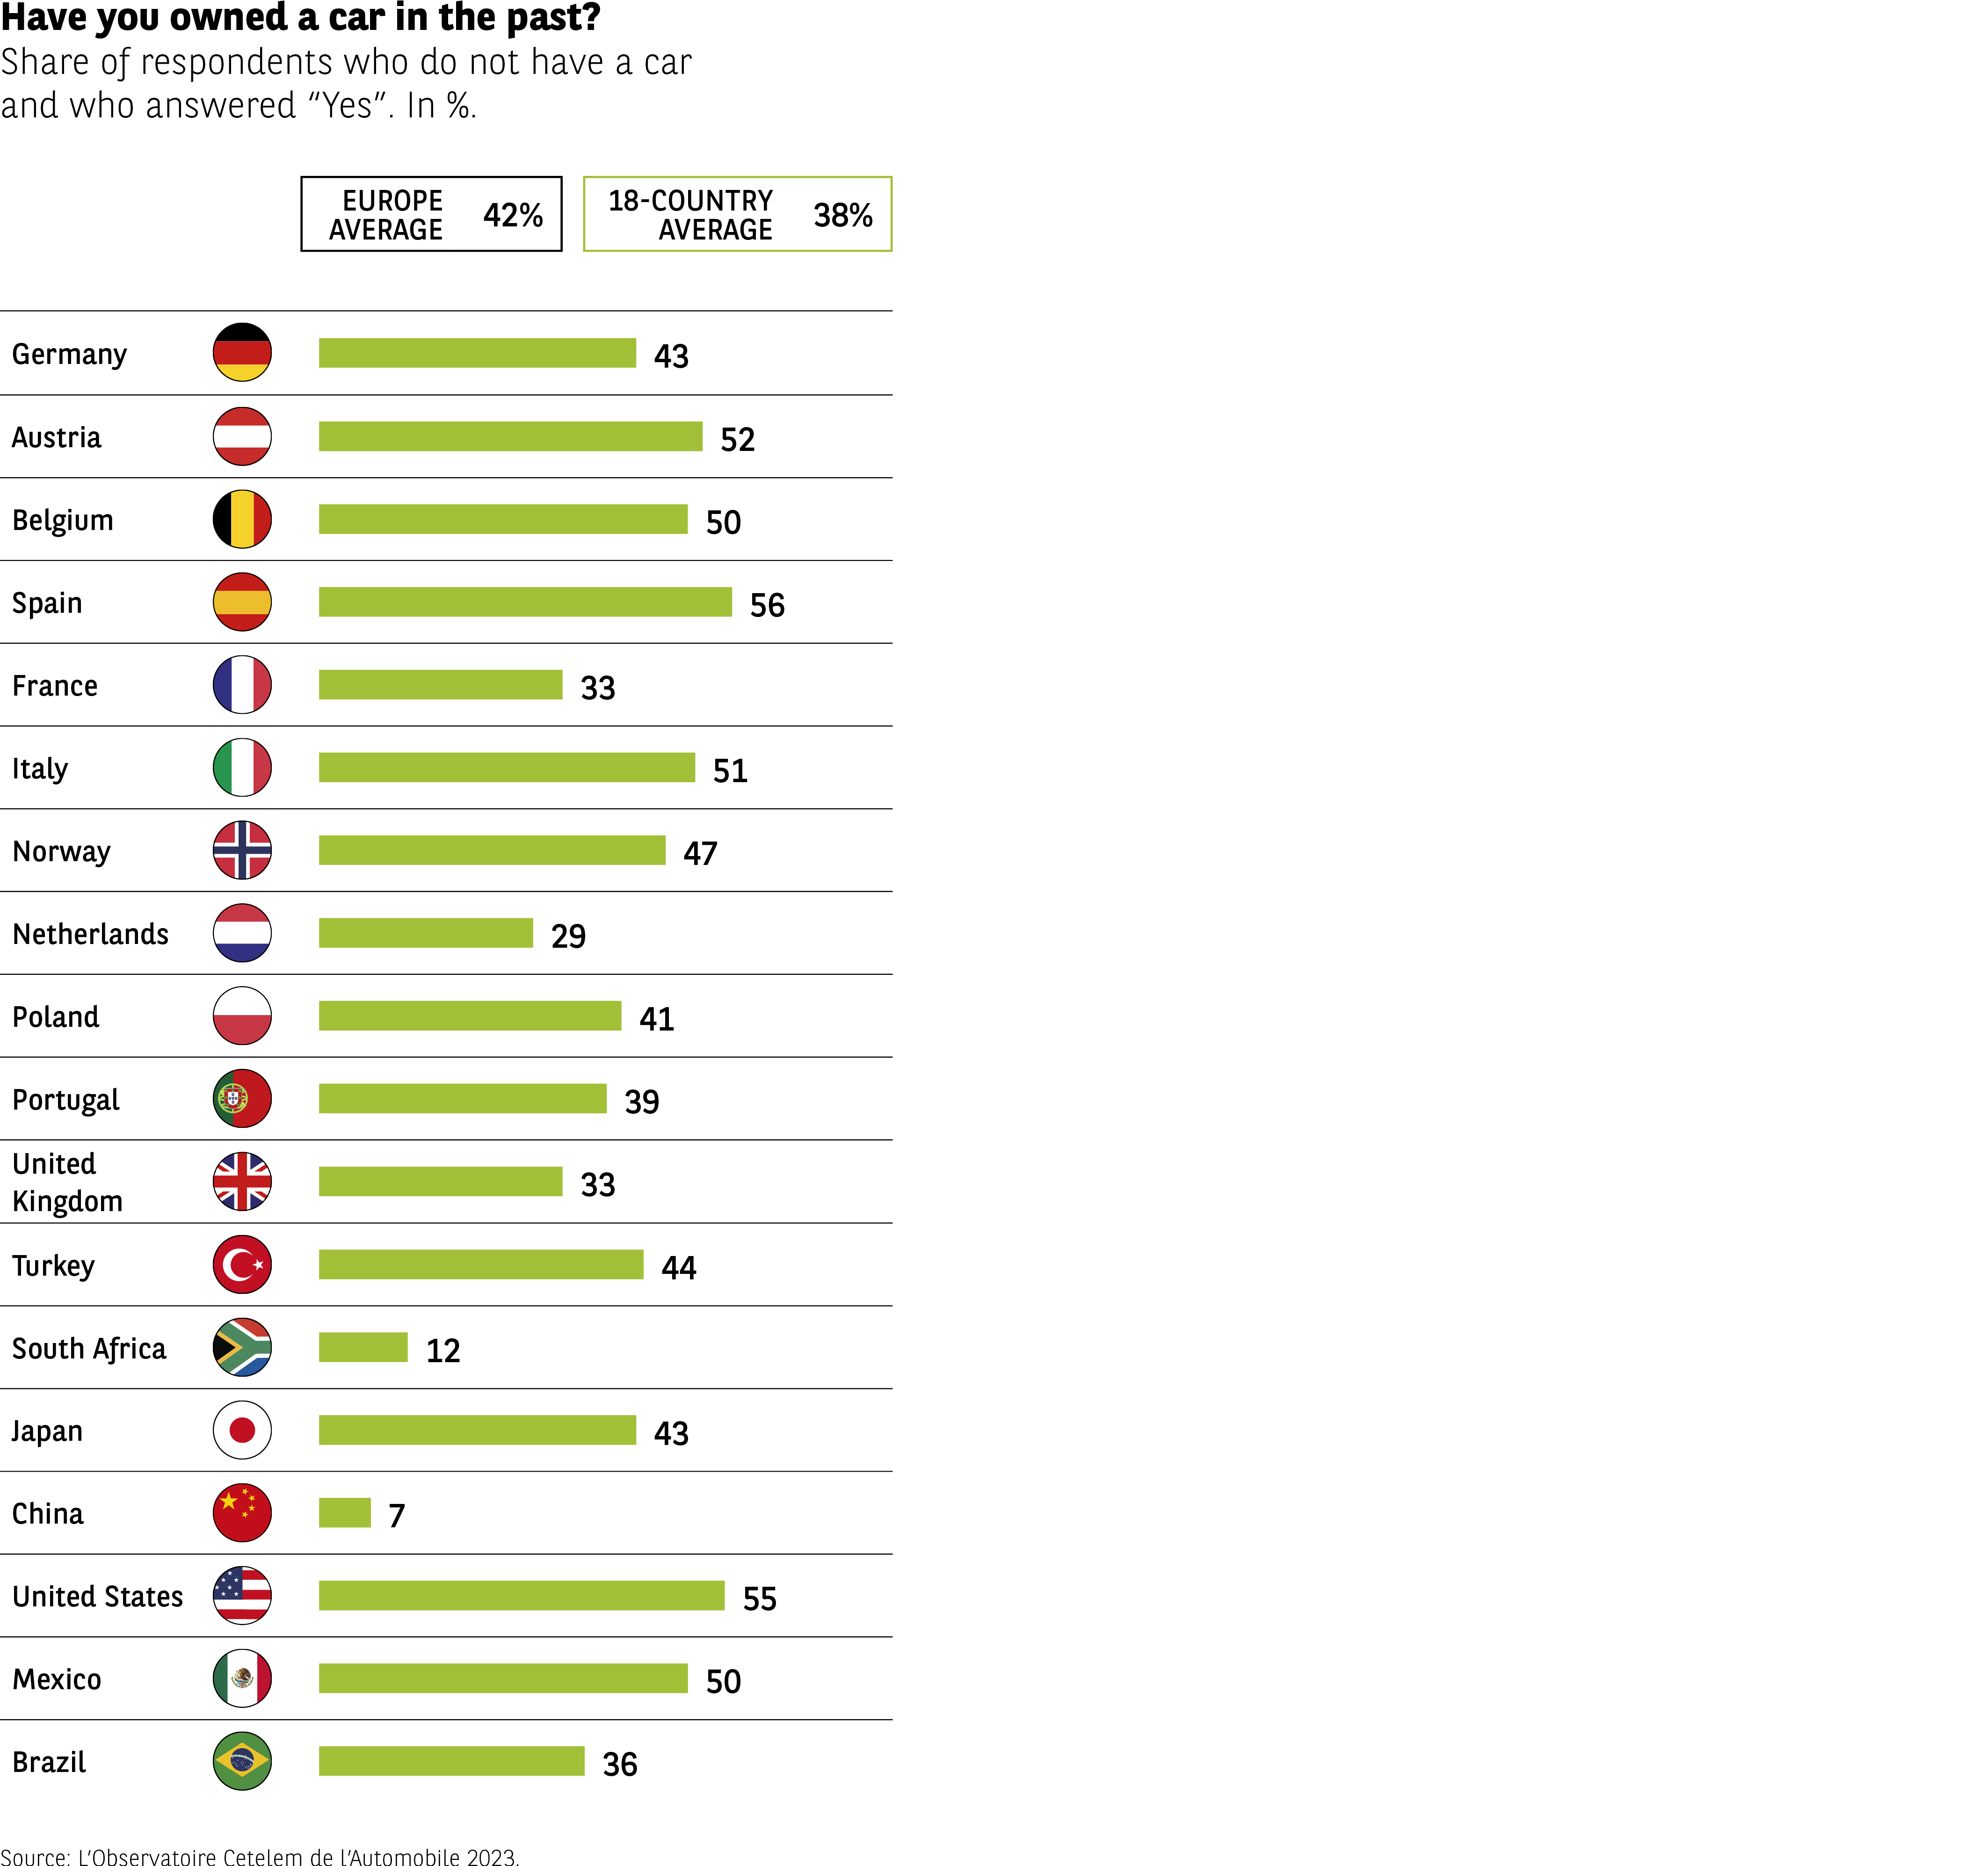 The infographic presents, among respondents who do not currently own a car, the percentage who have previously owned one.
Averages:
– Europe: 42%
– 18-country average: 38%
Countries (in %):
Germany 43
Austria 52
Belgium 50
Spain 56
France 33
Italy 51
Norway 47
Netherlands 29
Poland 41
Portugal 39
United Kingdom 33
Turkey 44
South Africa 12
Japan 43
China 7
United States 55
Mexico 50
Brazil 36
Large differences appear between countries, with very low levels in China and South Africa and higher levels in Spain and the United States.
Source: Observatoire Cetelem de l’Automobile 2023.
The infographic presents, among respondents who do not currently own a car, the percentage who have previously owned one.
Averages:
– Europe: 42%
– 18-country average: 38%
Countries (in %):
Germany 43
Austria 52
Belgium 50
Spain 56
France 33
Italy 51
Norway 47
Netherlands 29
Poland 41
Portugal 39
United Kingdom 33
Turkey 44
South Africa 12
Japan 43
China 7
United States 55
Mexico 50
Brazil 36
Large differences appear between countries, with very low levels in China and South Africa and higher levels in Spain and the United States.
Source: Observatoire Cetelem de l’Automobile 2023.
Personal difficulties are on their way
When they imagine themselves in a potentially car-free world, motorists focus primarily on the issues that will affect them personally, before thinking about other more general considerations. The possibility that they will be able to travel less easily is the first thing on their minds (Fig 50). This answer tops the list in 15 of the countries surveyed. The second-biggest consequence of living car free, after restricted ease of travel, is that journeys become more arduous. That’s according to motorists in 15 countries. It should be pointed out that these two criteria come either first or second in all the countries surveyed.
There is less agreement among respondents as we move down the list, but they do highlight certain more positive consequences. The first is the fact that their budget would be reduced, thanks to fewer expenses. Next comes the environmental impact of having fewer cars on the road, which would lead to lower emissions.
Rural and urban dwellers rank these consequences in almost the same order, although the greater difficulty involved in getting around is mentioned more frequently by those in rural areas (17 out of 18 countries).
Fig 50 – First thoughts if losing access to a car
Download this infographic for your presentations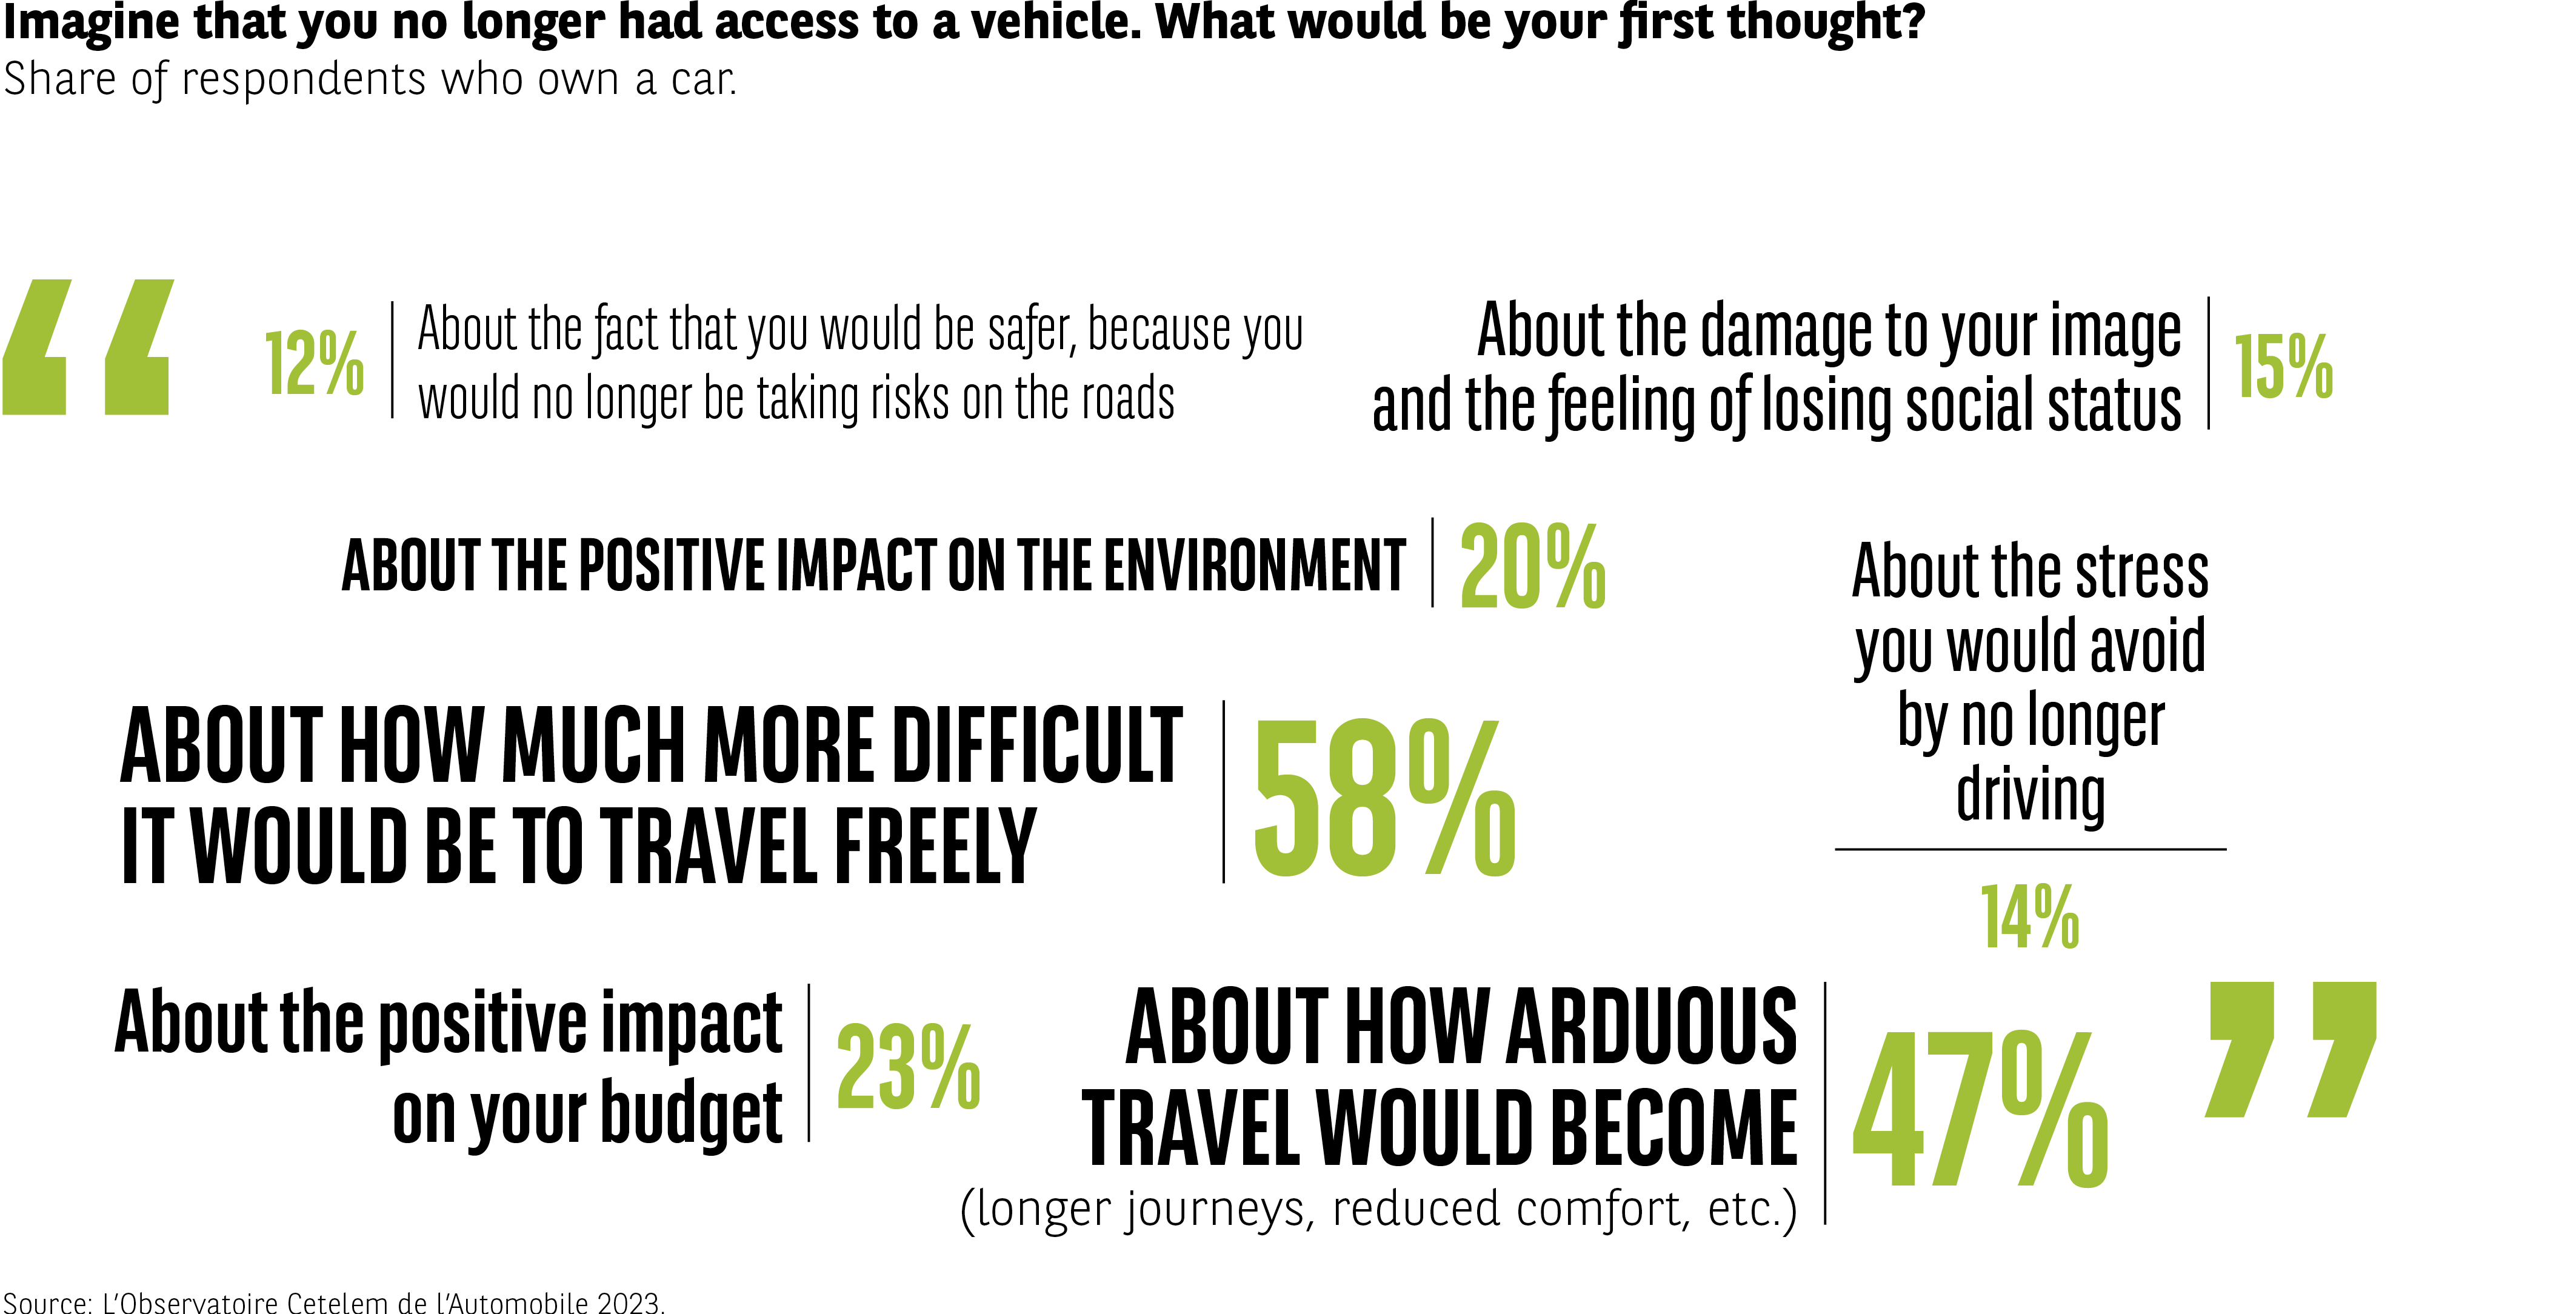 The infographic shows what car owners say they would think of first if they could no longer use a vehicle.
Values:
– Greater safety, fewer risks on the road: 12%
– Feeling of social downgrading: 15%
– Positive environmental impact: 20%
– Reduced stress from no longer driving: 14%
– Difficulty moving around as desired: 58%
– Positive impact on budget: 23%
– More difficult travel (longer, less comfortable): 47%
The dominant concerns are mobility constraints and reduced comfort, while positive consequences are mentioned less frequently.
Source: Observatoire Cetelem de l’Automobile 2023.
The infographic shows what car owners say they would think of first if they could no longer use a vehicle.
Values:
– Greater safety, fewer risks on the road: 12%
– Feeling of social downgrading: 15%
– Positive environmental impact: 20%
– Reduced stress from no longer driving: 14%
– Difficulty moving around as desired: 58%
– Positive impact on budget: 23%
– More difficult travel (longer, less comfortable): 47%
The dominant concerns are mobility constraints and reduced comfort, while positive consequences are mentioned less frequently.
Source: Observatoire Cetelem de l’Automobile 2023.
Price, the glass ceiling of the automotive world
High prices prohibit ownership
You don’t have to look far to find reasons not to own a car. One crucial factor is the financial side of things. 6 out of 10 non-car owners state that they have to do without a car because of the high cost of both buying and owning one (Fig 51). In all countries, this is the factor that takes precedence over any other consideration. This reason is slightly more powerful for urbanites than it is for rural dwellers, since the parking costs they incur are undoubtedly greater (e.g., in 2019, a month in a car park cost €328 in the Netherlands, €255 in the UK and €157 in France*). From a generational standpoint, this cost weighs more heavily on the under-35s.
The second reason why people live without a car is the public transport network they have available to them (23%). Urbanites are much more likely to make this point. A geographical analysis shows that the Japanese are so satisfied with their public transport systems (51%) that this is their primary reason for not owning a vehicle. At the other end of the scale we find the Brazilians, few of whom are satisfied (9%).
1 in 5 people state that they do not need a car, something that is more common among the over-35s. The inability to drive accounts for 15% of cases. Environmental considerations are barely mentioned. Only 8% of the people interviewed mention this issue.
* Source : Parkopedia.
Fig 51 – Reasons for no longer owning a car
Download this infographic for your presentations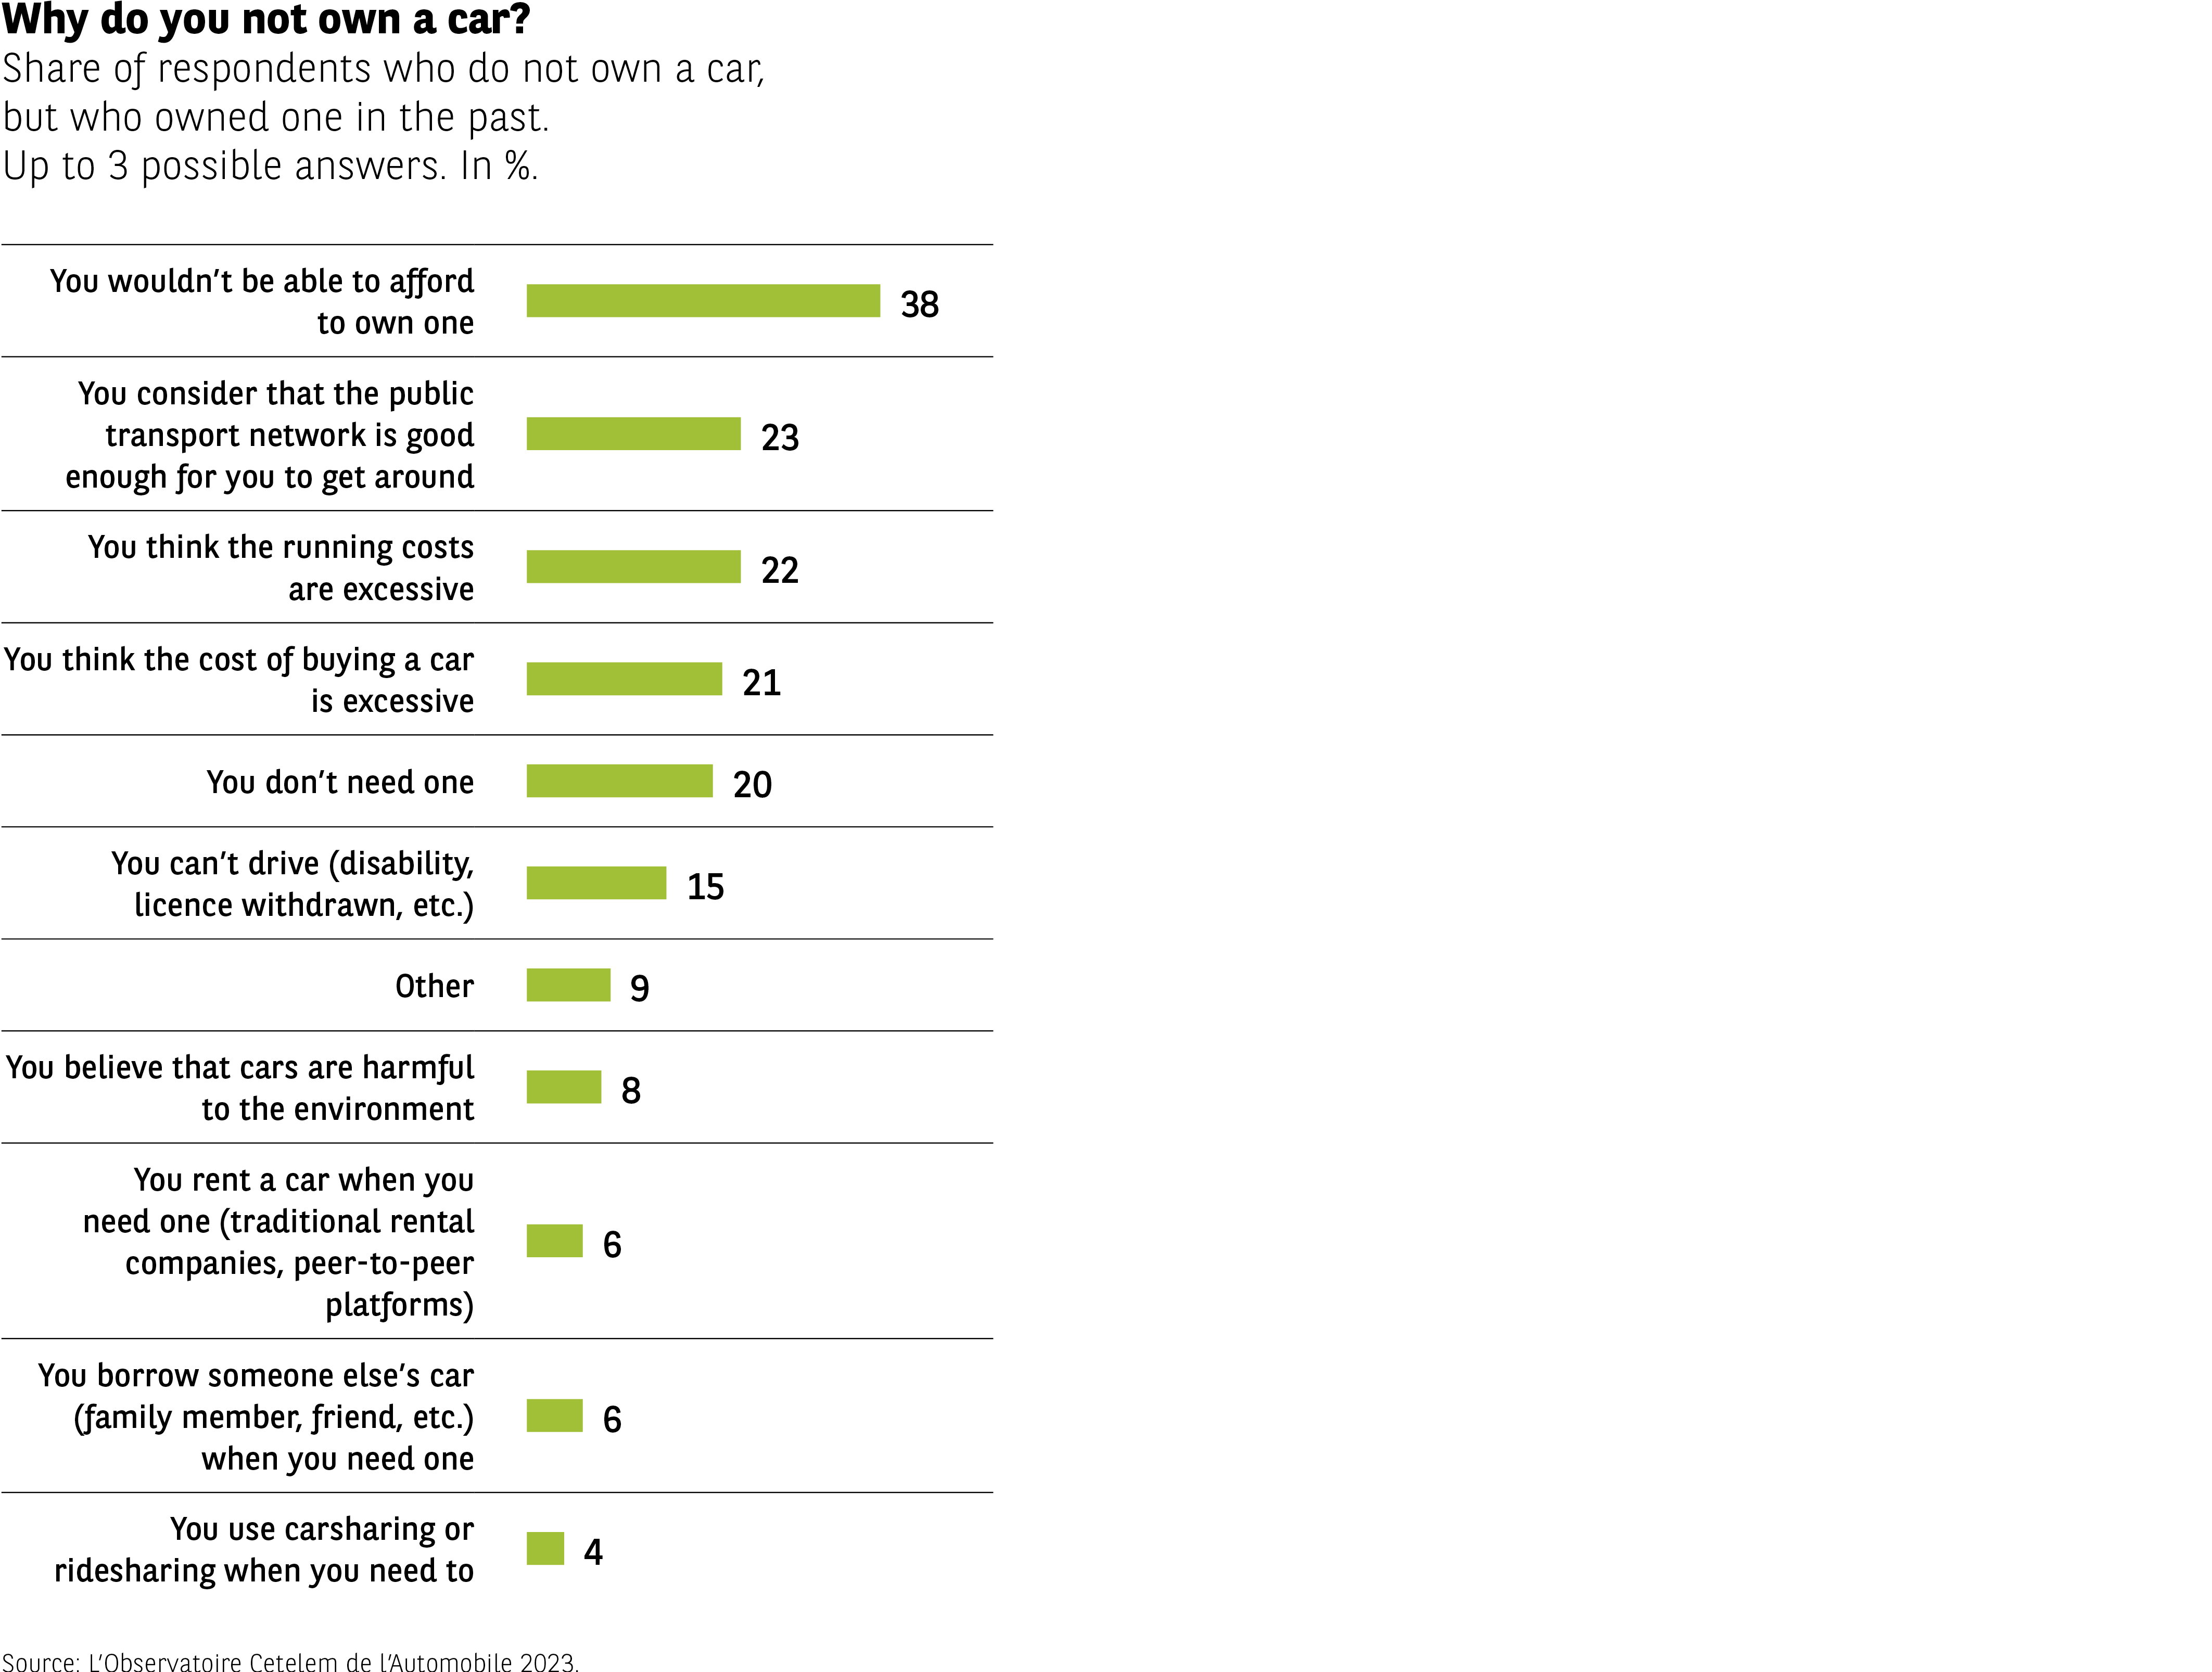 The infographic shows reasons given by respondents who once owned a car but do not own one anymore.
Values:
– Lack of financial means to own one: 38%
– Public transport network is sufficient: 23%
– Running costs too high: 22%
– Purchase cost too high: 21%
– No need for a car: 20%
– No longer able to drive or licence lost: 15%
– Other reasons: 9%
– Negative environmental impact of cars: 8%
– Renting a car when needed: 6%
– Borrowing a car from someone: 6%
– Using car-sharing or ride-sharing when needed: 4%
Financial constraints are the most cited reason, followed by alternatives being sufficient or costs being too high.
Source: Observatoire Cetelem de l’Automobile 2023.
The infographic shows reasons given by respondents who once owned a car but do not own one anymore.
Values:
– Lack of financial means to own one: 38%
– Public transport network is sufficient: 23%
– Running costs too high: 22%
– Purchase cost too high: 21%
– No need for a car: 20%
– No longer able to drive or licence lost: 15%
– Other reasons: 9%
– Negative environmental impact of cars: 8%
– Renting a car when needed: 6%
– Borrowing a car from someone: 6%
– Using car-sharing or ride-sharing when needed: 4%
Financial constraints are the most cited reason, followed by alternatives being sufficient or costs being too high.
Source: Observatoire Cetelem de l’Automobile 2023.
Buying new is a tough step to take
When it comes to switching from a used car to a new car, cause and effect are at play once again, but in even greater proportions. Indeed, 84% of those surveyed refuse to acquire a new vehicle for reasons of cost (Fig 52). The distant cousins of Brazil and Portugal are almost unanimously of this opinion, as are the Mexicans. Only the Americans, with a score of 72%, are slightly less likely to bemoan this financial obstacle. The French find themselves 4 points below the average.
Fig 52 – Renunciation of buying a new vehicle
Download this infographic for your presentations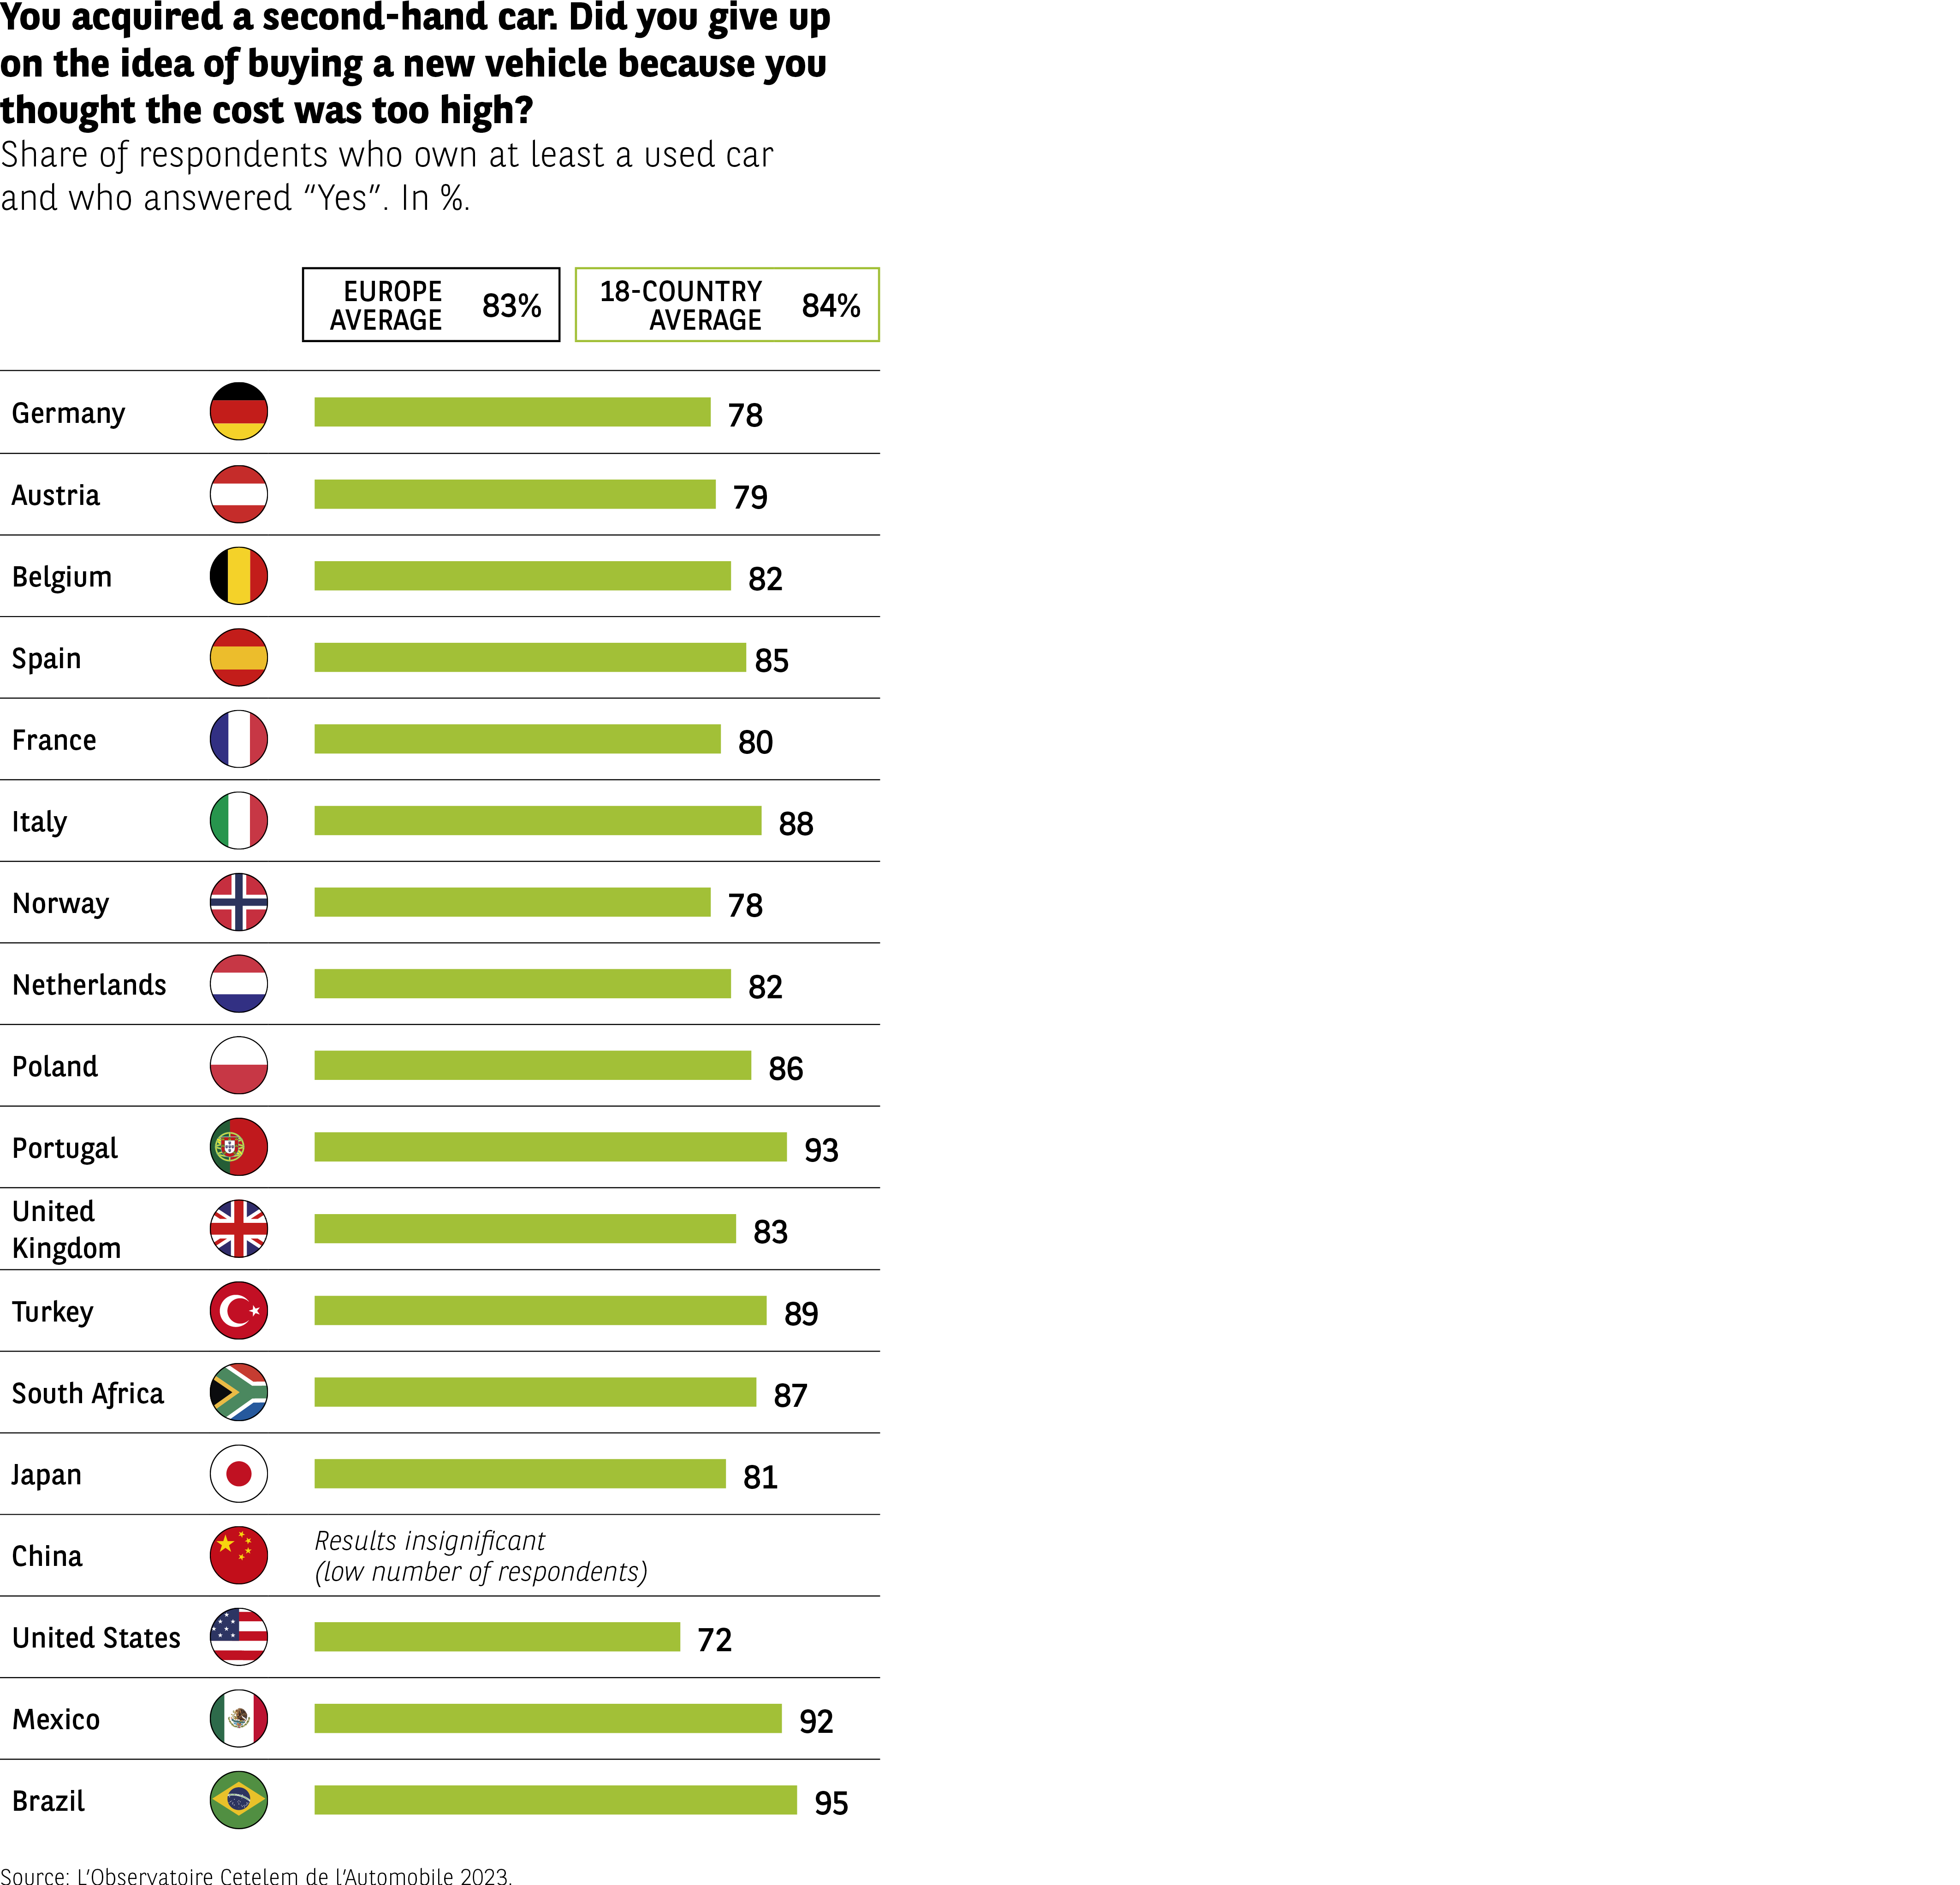 The infographic shows the percentage of respondents who purchased a used vehicle and report having renounced buying a new one because the price was too high.
Averages:
– Europe: 83%
– 18-country average: 84%
Countries:
Germany 78%
Austria 79%
Belgium 82%
Spain 85%
France 80%
Italy 88%
Norway 78%
Netherlands 82%
Poland 86%
Portugal 93%
United Kingdom 83%
Turkey 89%
South Africa 87%
Japan 81%
China: results not significant (sample too small)
United States 72%
Mexico 92%
Brazil 95%
In nearly all countries, a very large majority reports giving up on buying a new vehicle due to excessive cost.
Source: Observatoire Cetelem de l’Automobile 2023.
The infographic shows the percentage of respondents who purchased a used vehicle and report having renounced buying a new one because the price was too high.
Averages:
– Europe: 83%
– 18-country average: 84%
Countries:
Germany 78%
Austria 79%
Belgium 82%
Spain 85%
France 80%
Italy 88%
Norway 78%
Netherlands 82%
Poland 86%
Portugal 93%
United Kingdom 83%
Turkey 89%
South Africa 87%
Japan 81%
China: results not significant (sample too small)
United States 72%
Mexico 92%
Brazil 95%
In nearly all countries, a very large majority reports giving up on buying a new vehicle due to excessive cost.
Source: Observatoire Cetelem de l’Automobile 2023.
Cutting down on cars
There is an even more drastic way of avoiding financial strife. This simple and radical solution is for a household to reduce its number of vehicles. 1 in 2 people have taken such action or have decided to do so in the near future (Fig 53). Along with the usual quartet formed by Turkey, South Africa, Mexico and Brazil, the Chinese show a clear inclination to adopt this kind of measure. Conversely, the Japanese and Dutch are resolutely keen on the status quo. The European countries surveyed all display a similar level of enthusiasm in this regard.
Fig 53 – Reduction in household vehicle count
Download this infographic for your presentations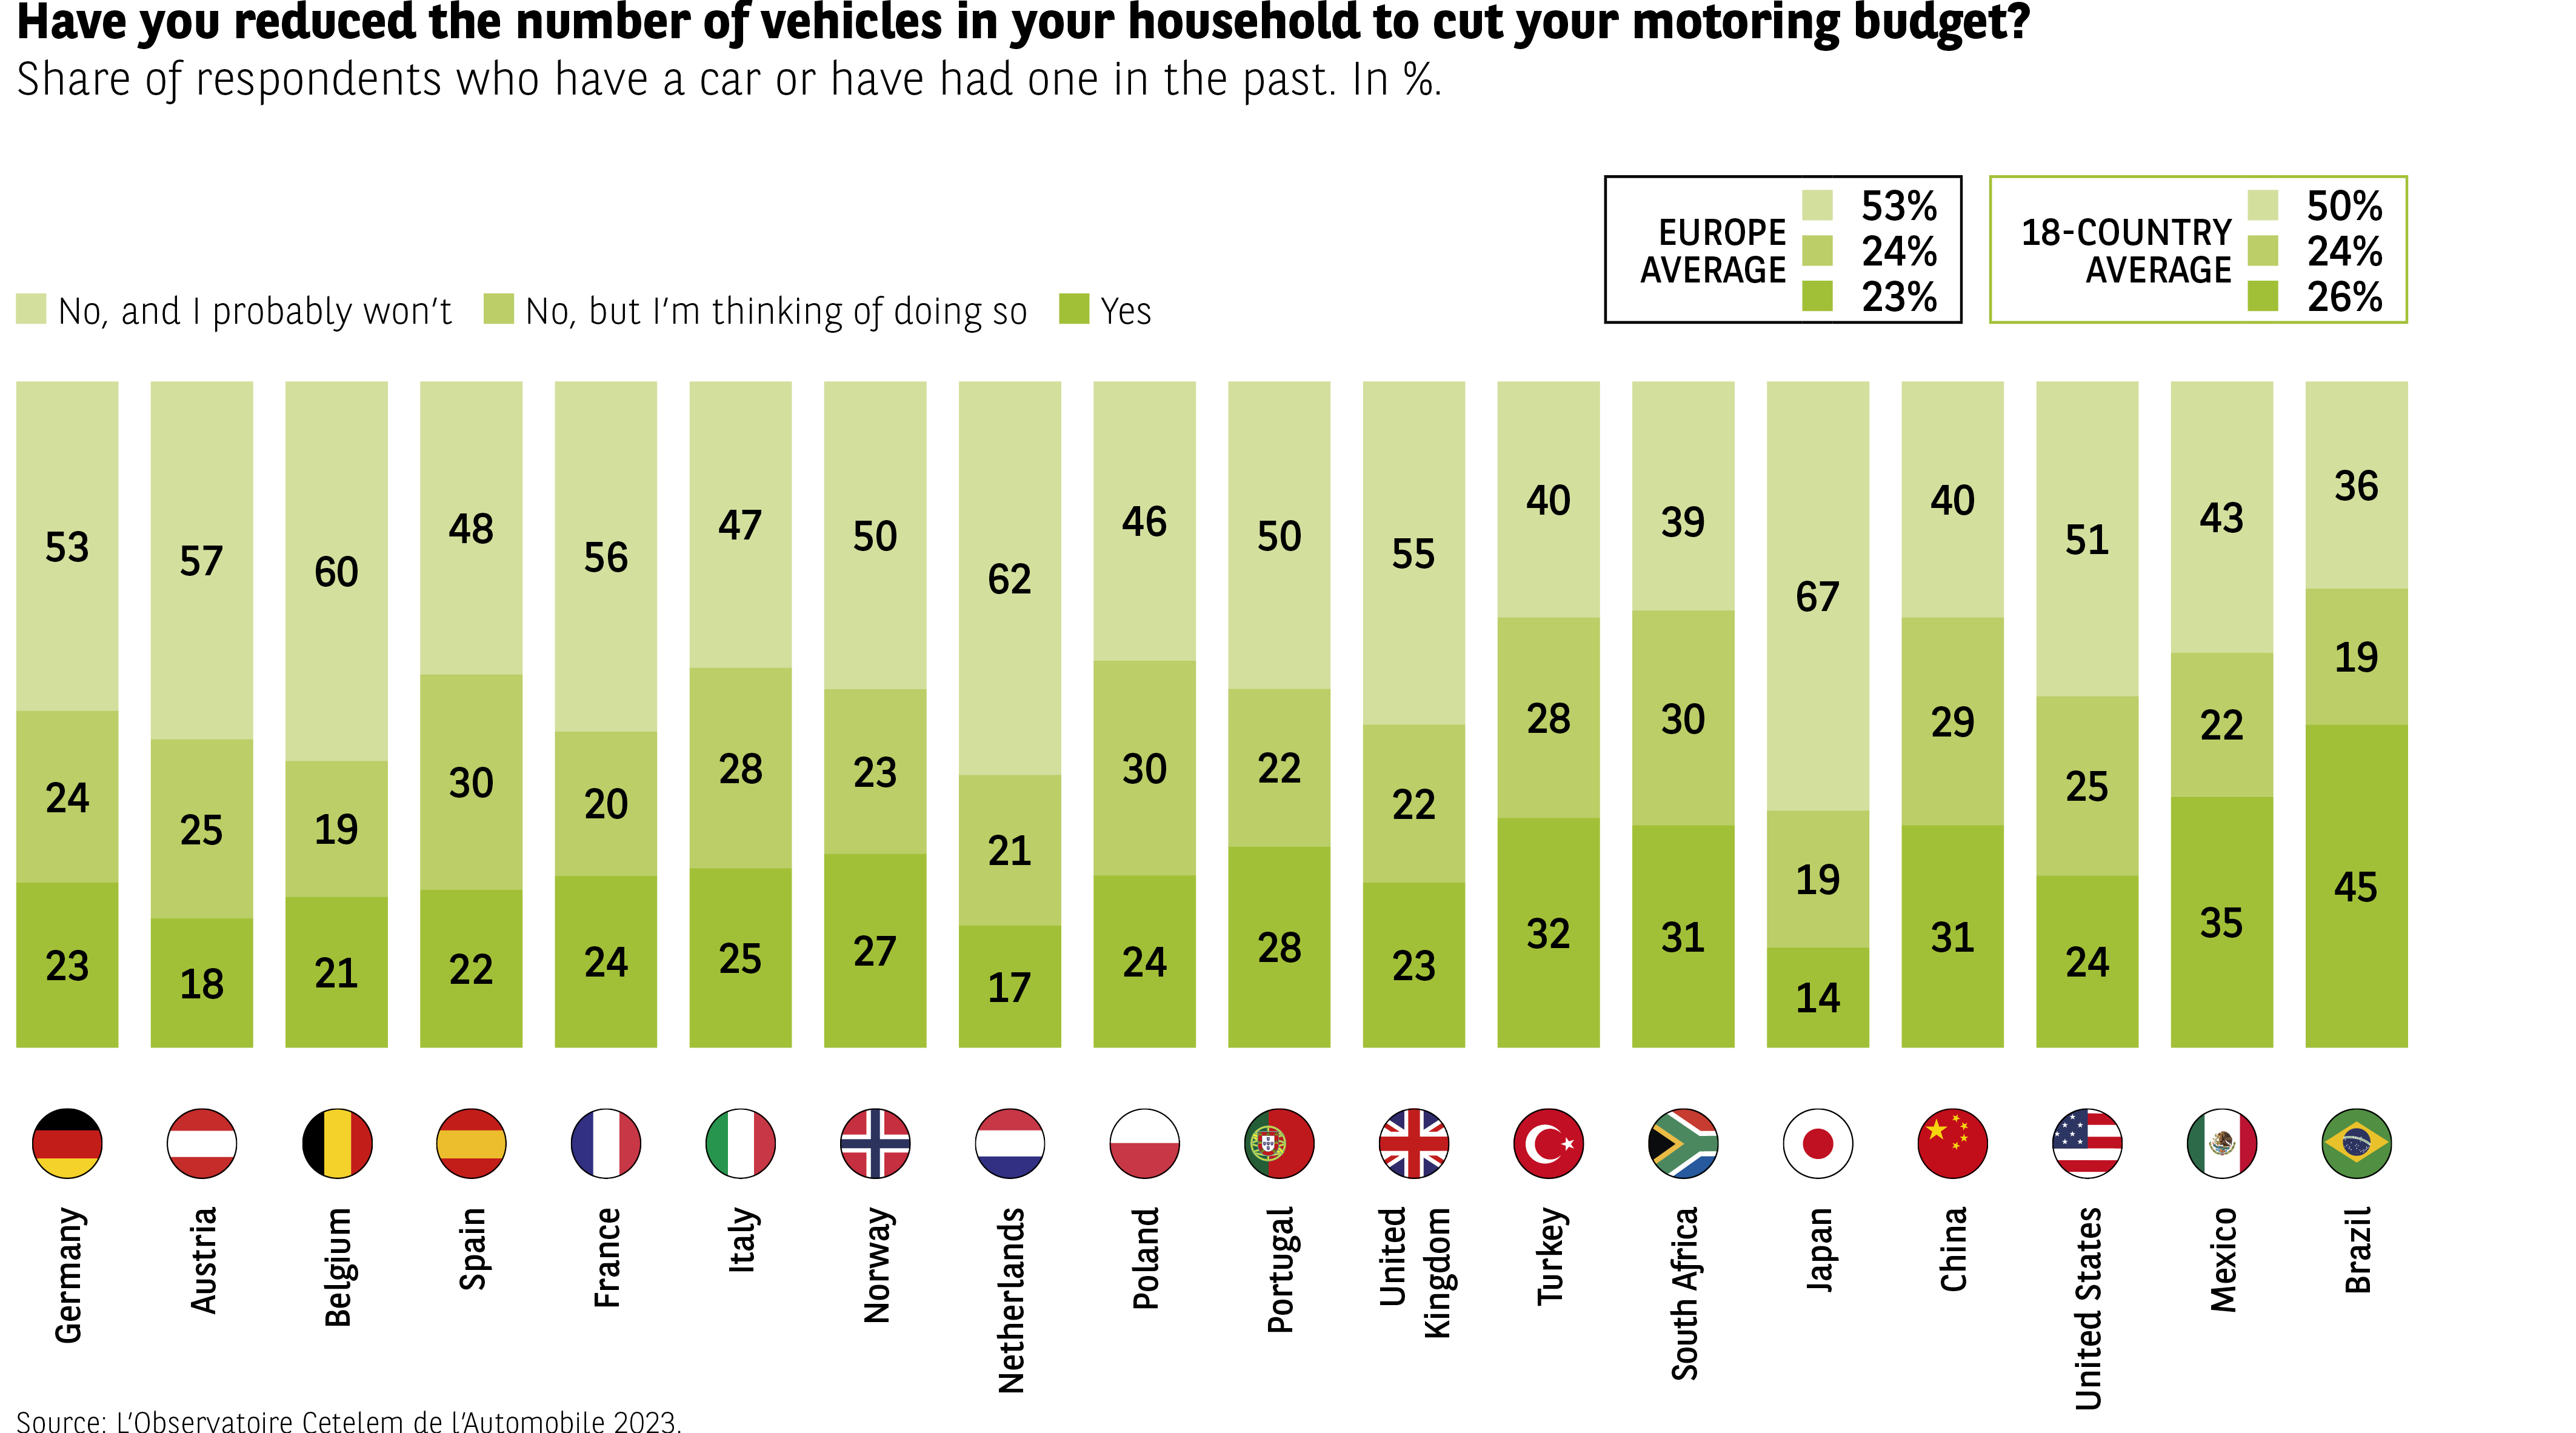 The infographic shows, for each country, the share of respondents who have already reduced the number of vehicles in their household, those who have not but may do so, and those who do not plan to do so.
Averages (yes / may / no):
– Europe: 23% / 24% / 53%
– 18-country average: 26% / 24% / 50%
Countries (yes / may / no):
Germany 23 / 24 / 53
Austria 18 / 25 / 57
Belgium 21 / 19 / 60
Spain 22 / 30 / 48
France 24 / 20 / 56
Italy 25 / 28 / 47
Norway 27 / 23 / 50
Netherlands 17 / 21 / 62
Poland 24 / 30 / 46
Portugal 28 / 22 / 50
United Kingdom 23 / 22 / 55
Turkey 32 / 28 / 40
South Africa 31 / 30 / 39
Japan 14 / 19 / 67
China 31 / 29 / 40
United States 24 / 25 / 51
Mexico 35 / 22 / 43
Brazil 45 / 19 / 36
Countries differ widely, with some showing significant reductions and others little change.
Source: Observatoire Cetelem de l’Automobile 2023.
The infographic shows, for each country, the share of respondents who have already reduced the number of vehicles in their household, those who have not but may do so, and those who do not plan to do so.
Averages (yes / may / no):
– Europe: 23% / 24% / 53%
– 18-country average: 26% / 24% / 50%
Countries (yes / may / no):
Germany 23 / 24 / 53
Austria 18 / 25 / 57
Belgium 21 / 19 / 60
Spain 22 / 30 / 48
France 24 / 20 / 56
Italy 25 / 28 / 47
Norway 27 / 23 / 50
Netherlands 17 / 21 / 62
Poland 24 / 30 / 46
Portugal 28 / 22 / 50
United Kingdom 23 / 22 / 55
Turkey 32 / 28 / 40
South Africa 31 / 30 / 39
Japan 14 / 19 / 67
China 31 / 29 / 40
United States 24 / 25 / 51
Mexico 35 / 22 / 43
Brazil 45 / 19 / 36
Countries differ widely, with some showing significant reductions and others little change.
Source: Observatoire Cetelem de l’Automobile 2023.
Car prices in France are increasing faster than anything else
In France, whether you compare it against inflation (Fig 54) or median income (Fig 55), the soaring price of vehicles trumps all other rises. This is what we are told by the statistics recorded between 2000 and 2020. Will the spectacular rise of inflation in recent months make a difference? Nothing could be less certain, because the gap is vast to say the least.
Fig 54 – Vehicle price trends vs inflation
Download this infographic for your presentations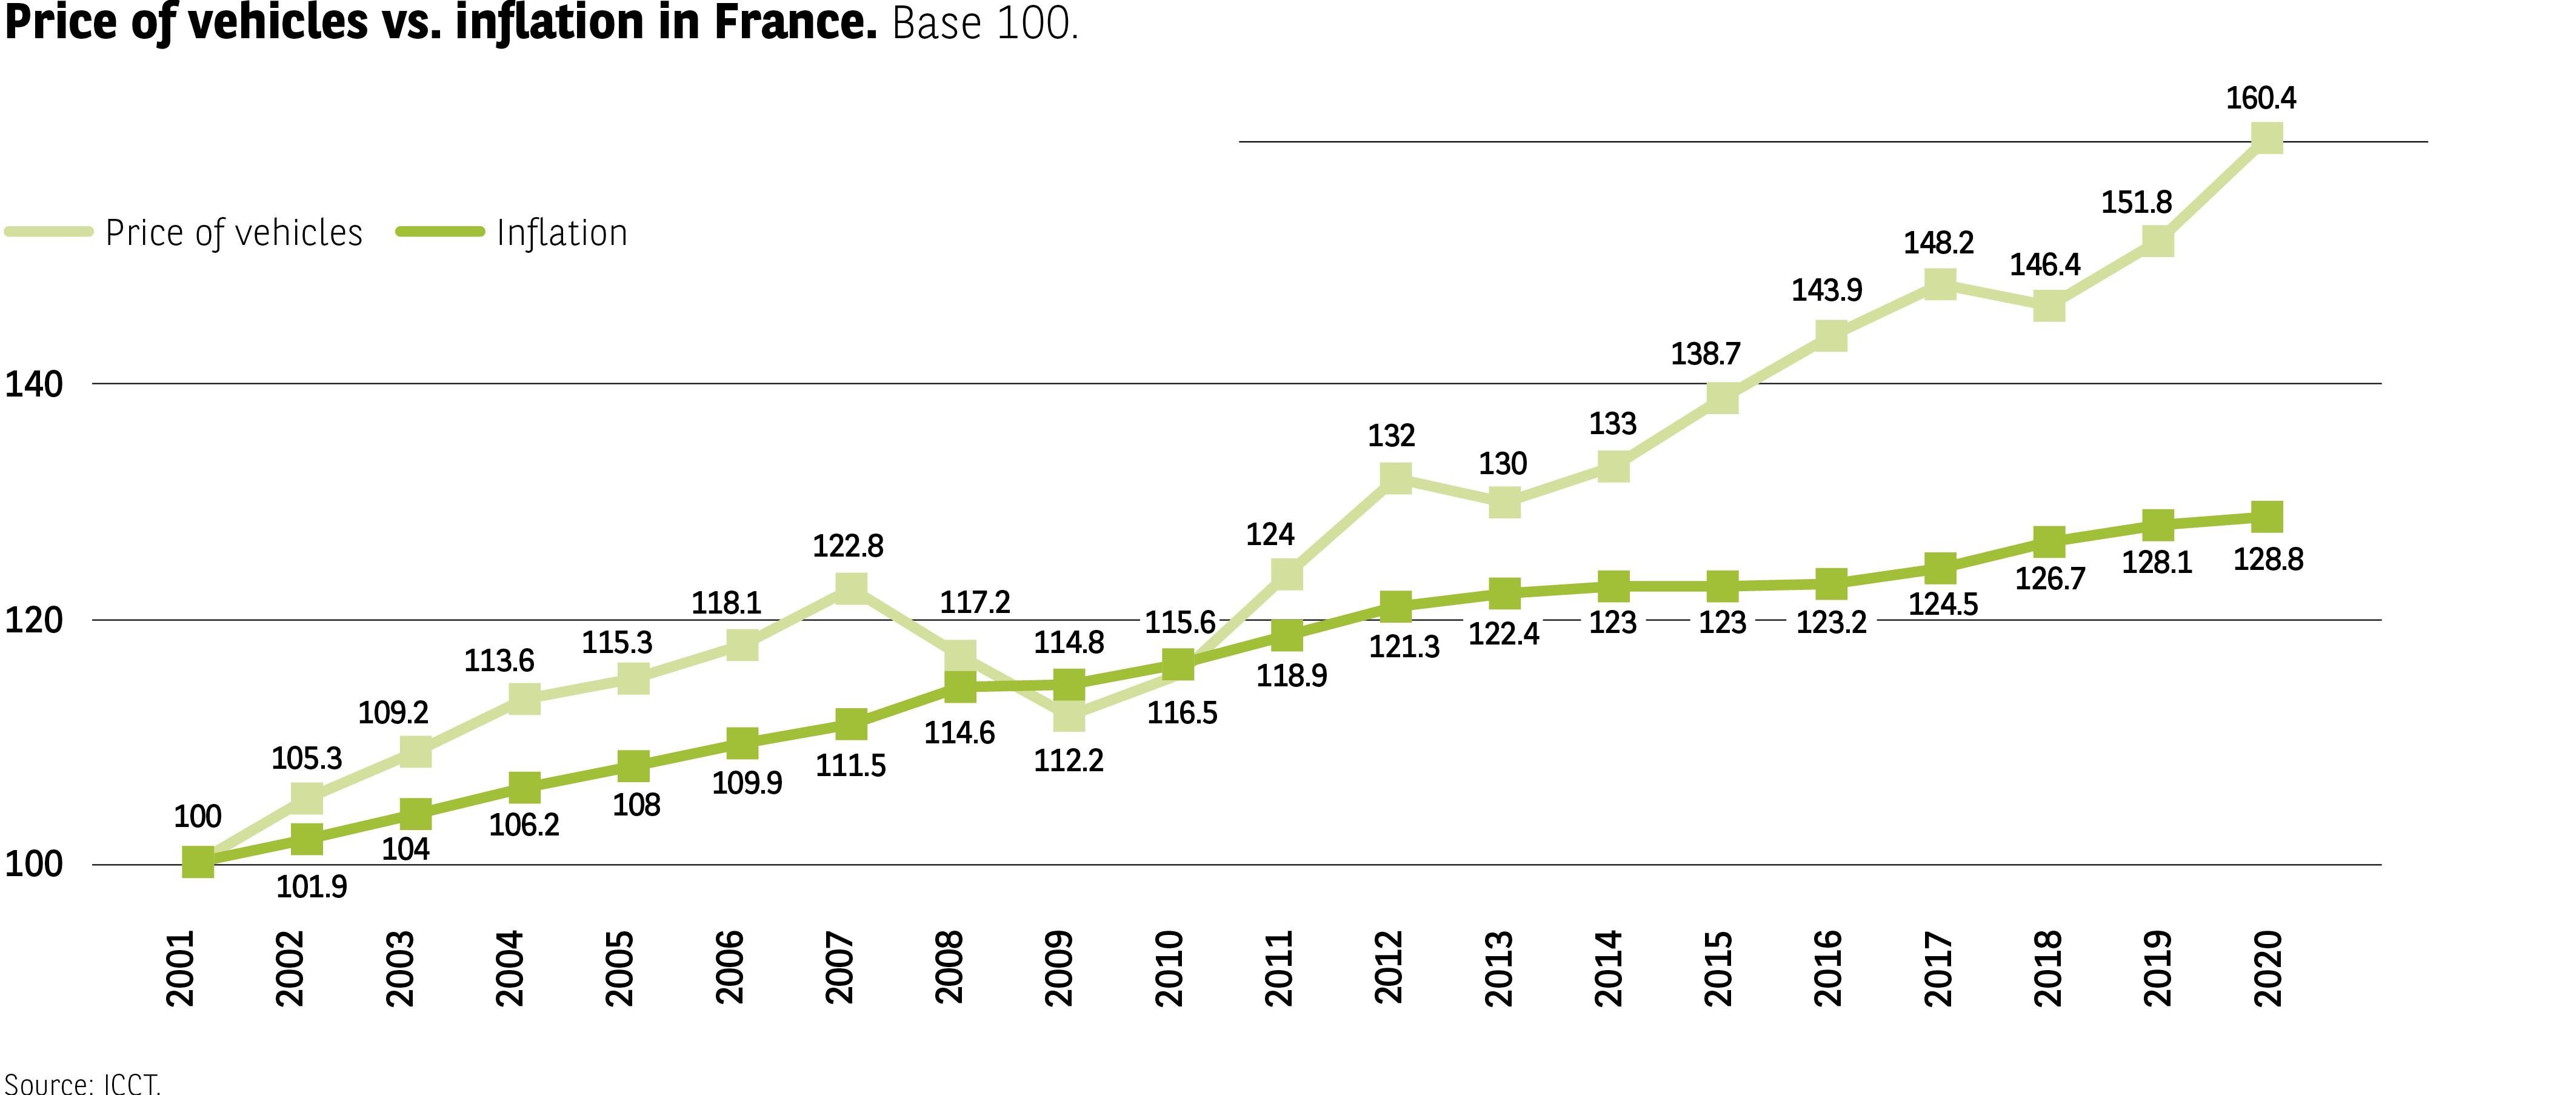 The infographic compares the evolution of vehicle prices with inflation in France from 2001 to 2020, with both starting at a base index of 100.
Values (vehicle prices / inflation):
2001: 100 / 100
2002: 101.9 / 105.3
2003: 104 / 109.2
2004: 106.2 / 113.6
2005: 108 / 115.3
2006: 109.9 / 118.1
2007: 111.5 / 122.8
2008: 114.6 / 117.2
2009: 112.2 / 114.8
2010: 115.6 / 116.5
2011: 118.9 / 124
2012: 119.3 / 132
2013: 122.3 / 130
2014: 123 / 133
2015: 123.2 / 138.7
2016: 124.5 / 143.9
2017: 126.7 / 148.2
2018: 128.1 / 146.4
2019: 128.8 / 151.8
2020: 128.8 / 160.4
Inflation rises much faster than vehicle prices over the period.
Source: ICCT.
The infographic compares the evolution of vehicle prices with inflation in France from 2001 to 2020, with both starting at a base index of 100.
Values (vehicle prices / inflation):
2001: 100 / 100
2002: 101.9 / 105.3
2003: 104 / 109.2
2004: 106.2 / 113.6
2005: 108 / 115.3
2006: 109.9 / 118.1
2007: 111.5 / 122.8
2008: 114.6 / 117.2
2009: 112.2 / 114.8
2010: 115.6 / 116.5
2011: 118.9 / 124
2012: 119.3 / 132
2013: 122.3 / 130
2014: 123 / 133
2015: 123.2 / 138.7
2016: 124.5 / 143.9
2017: 126.7 / 148.2
2018: 128.1 / 146.4
2019: 128.8 / 151.8
2020: 128.8 / 160.4
Inflation rises much faster than vehicle prices over the period.
Source: ICCT.
Fig 55 – Vehicle prices vs household income
Download this infographic for your presentations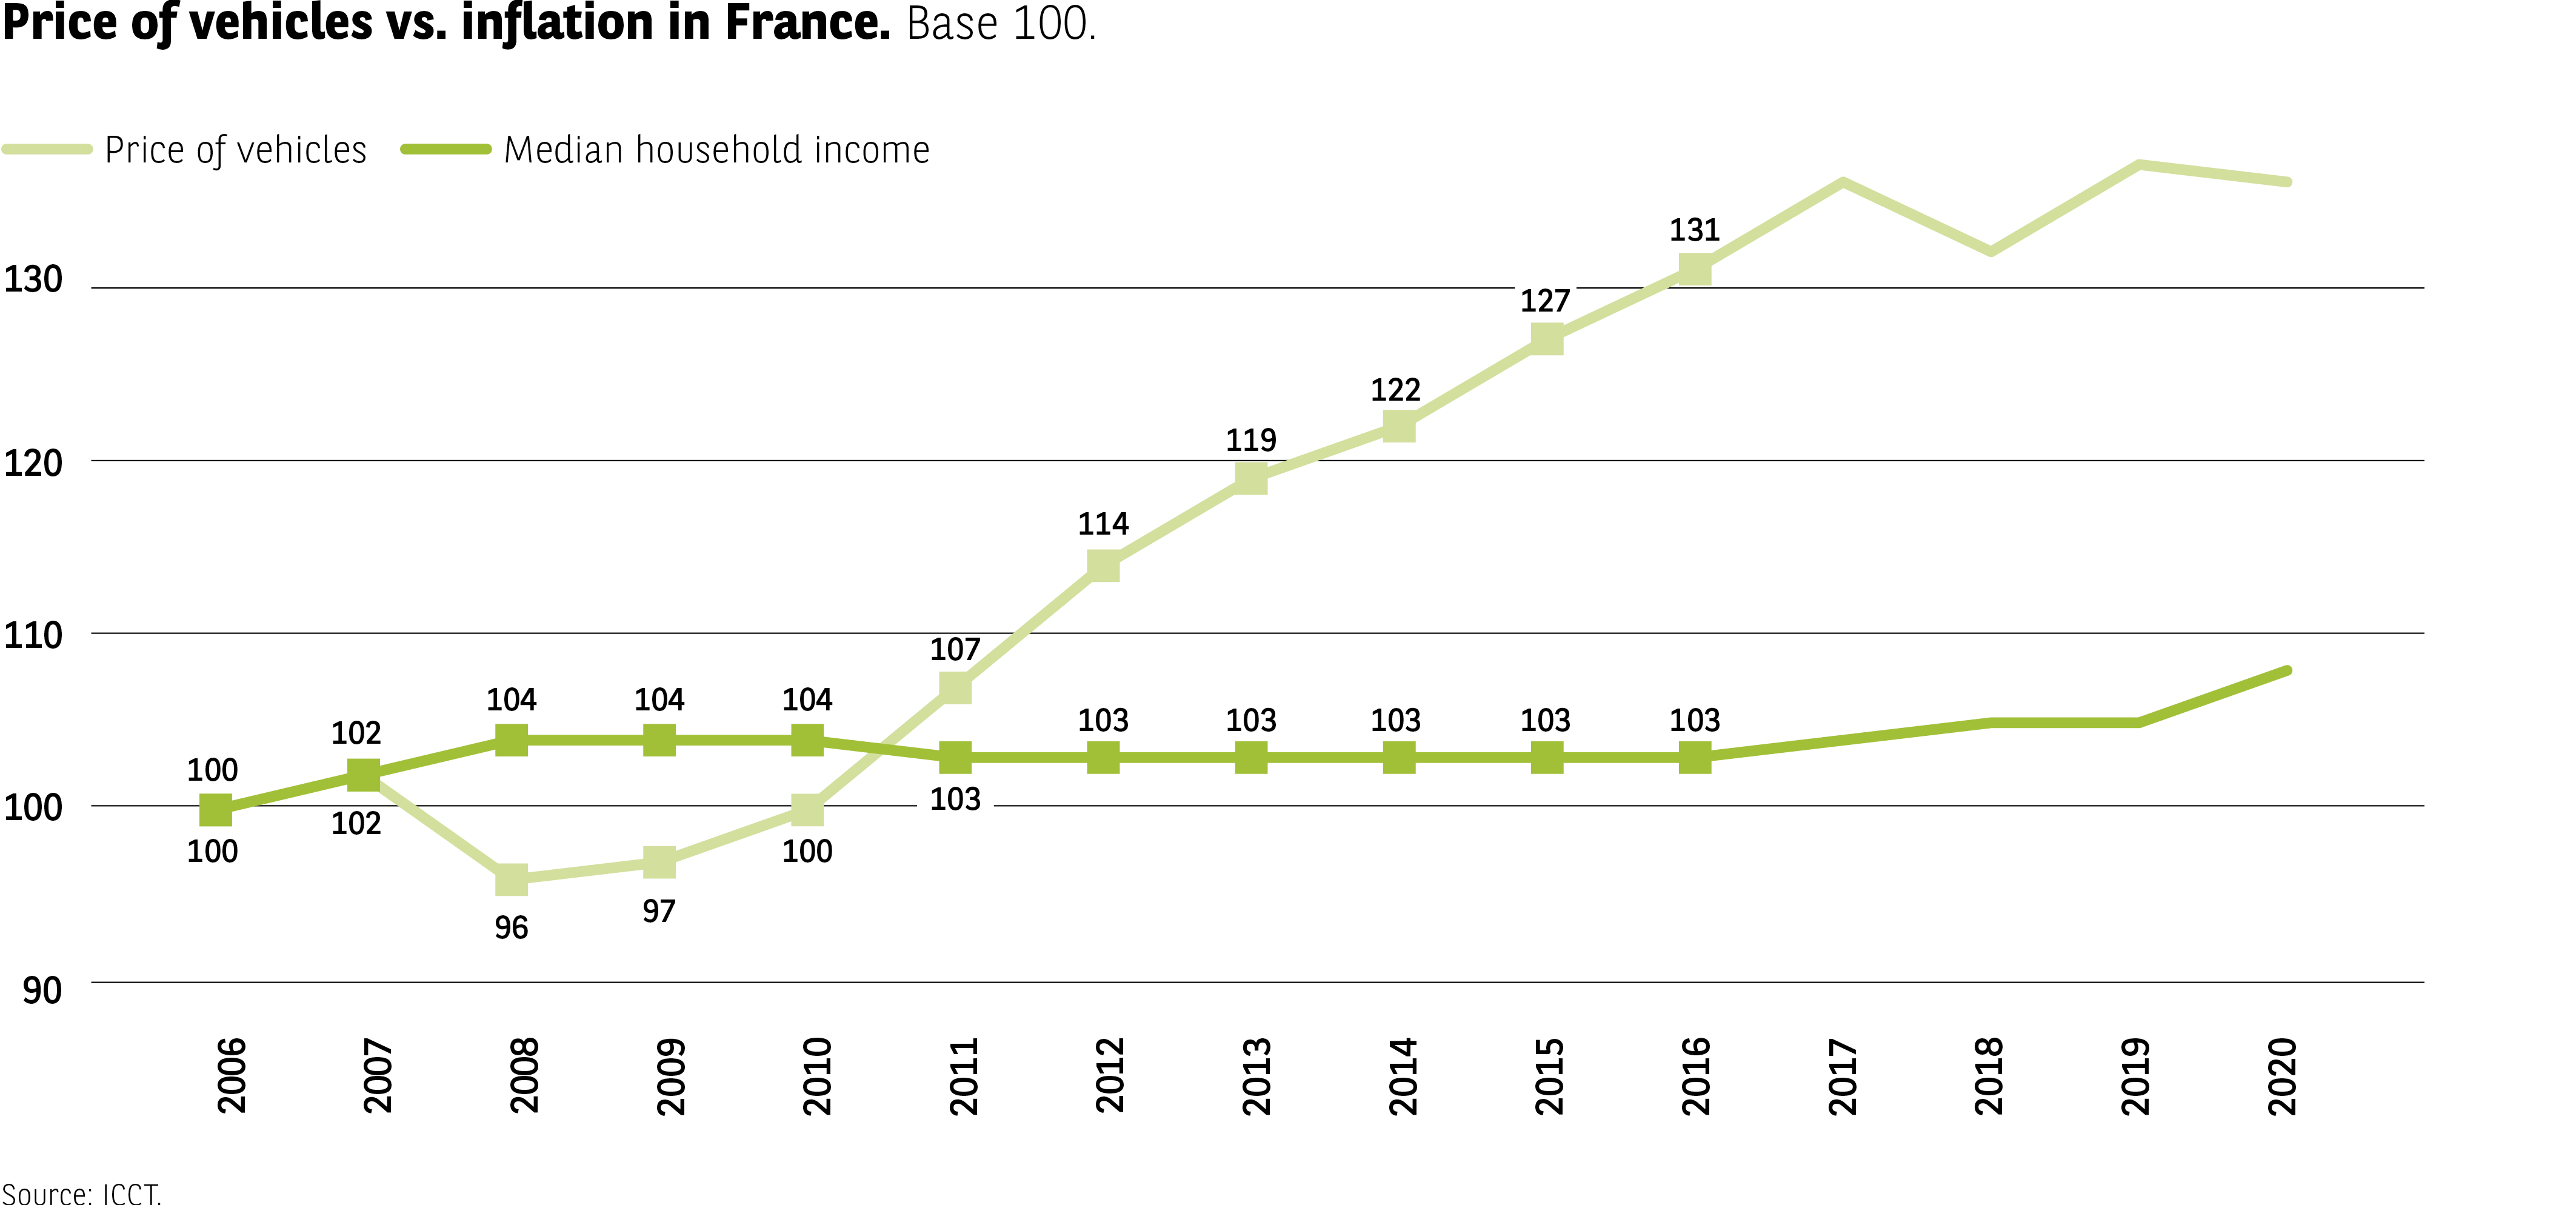 The infographic compares the evolution of vehicle prices with the evolution of median household income in France, from 2006 to 2020.
Values (vehicle price index / median household income index):
2006: 100 / 100
2007: 102 / 102
2008: 96 / 104
2009: 97 / 104
2010: 100 / 104
2011: 107 / 103
2012: 114 / 103
2013: 119 / 103
2014: 122 / 103
2015: 127 / 103
2016: 131 / 103
2017: 136 / 104
2018: 132 / 105
2019: 137 / 105
2020: 136 / 108
Vehicle prices grow significantly faster than household median income, which remains nearly flat until 2016 and then rises slightly.
Source: ICCT.
The infographic compares the evolution of vehicle prices with the evolution of median household income in France, from 2006 to 2020.
Values (vehicle price index / median household income index):
2006: 100 / 100
2007: 102 / 102
2008: 96 / 104
2009: 97 / 104
2010: 100 / 104
2011: 107 / 103
2012: 114 / 103
2013: 119 / 103
2014: 122 / 103
2015: 127 / 103
2016: 131 / 103
2017: 136 / 104
2018: 132 / 105
2019: 137 / 105
2020: 136 / 108
Vehicle prices grow significantly faster than household median income, which remains nearly flat until 2016 and then rises slightly.
Source: ICCT.