Using your car: the costs add up


While consumers may consider the price of vehicles to be relatively reasonable, the same cannot be said for their running costs. In addition, there are marked differences from one type of expense to the next.
Expensive overall
A sizeable cost burden
A majority of motorists are adamant that the overall cost of owning a vehicle is high relative to the finances at their disposal. 6 out of 10 are of this opinion. This is a minority position in only three countries, with the Chinese being the least likely to complain about the high cost of motoring. Conversely, the Turks, for the reasons mentioned previously, as well as the Brazilians, are overwhelmingly likely to decry the sizeable budget required (Fig 12).
Fig 12 – Perception of a vehicle’s overall budget
Download this infographic for your presentations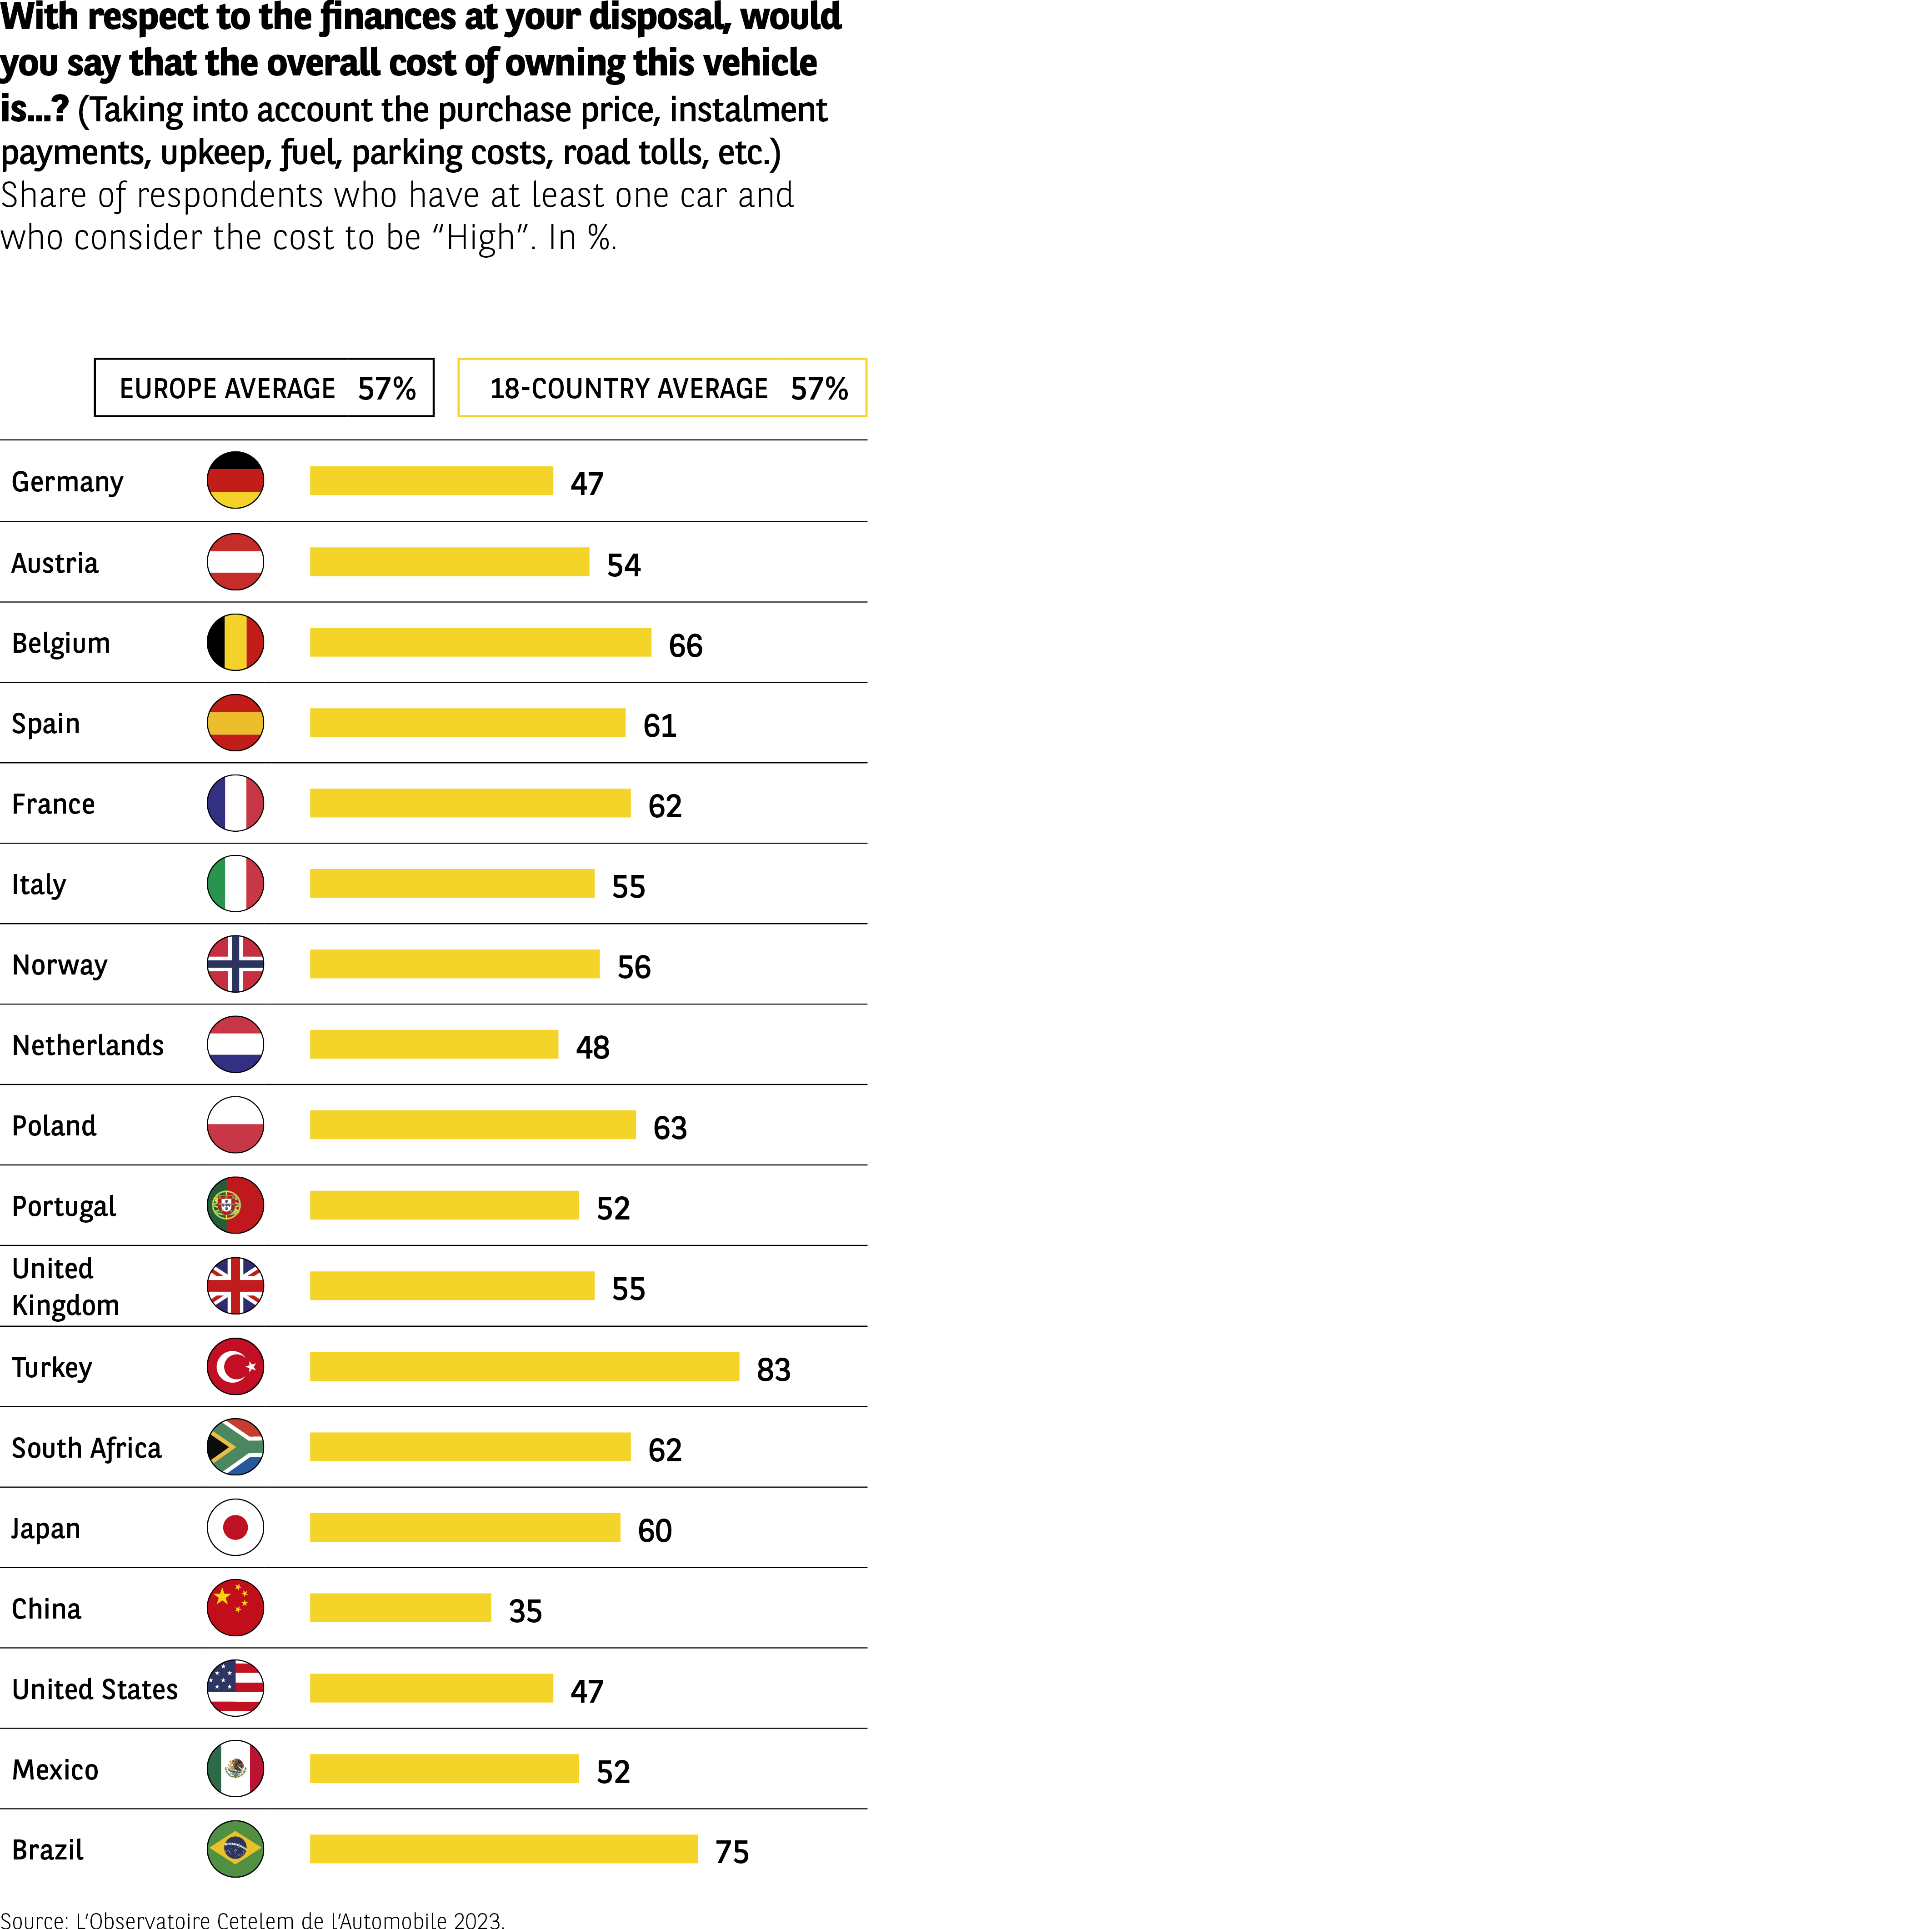 The infographic shows the proportion of respondents who feel that the overall budget for their vehicle — including purchase, lease if applicable, maintenance, fuel, parking, and tolls — is “high” relative to their financial means.
Two reference values are shown:
– Europe average: 57%
– 18-country average: 57%
Country data (in %):
Germany: 47
Austria: 54
Belgium: 66
Spain: 61
France: 62
Italy: 55
Norway: 56
Netherlands: 48
Poland: 63
Portugal: 52
United Kingdom: 55
Turkey: 83
South Africa: 62
Japan: 60
China: 35
United States: 47
Mexico: 52
Brazil: 75
Turkey and Brazil show the highest levels of “budget too high.”
China is the country with the lowest share (35%).
Most European countries fall between 50% and 65%, close to the average.
Source: Observatoire Cetelem 2023
The infographic shows the proportion of respondents who feel that the overall budget for their vehicle — including purchase, lease if applicable, maintenance, fuel, parking, and tolls — is “high” relative to their financial means.
Two reference values are shown:
– Europe average: 57%
– 18-country average: 57%
Country data (in %):
Germany: 47
Austria: 54
Belgium: 66
Spain: 61
France: 62
Italy: 55
Norway: 56
Netherlands: 48
Poland: 63
Portugal: 52
United Kingdom: 55
Turkey: 83
South Africa: 62
Japan: 60
China: 35
United States: 47
Mexico: 52
Brazil: 75
Turkey and Brazil show the highest levels of “budget too high.”
China is the country with the lowest share (35%).
Most European countries fall between 50% and 65%, close to the average.
Source: Observatoire Cetelem 2023
If we look purely at the monetary data, automobile-related expenses are the highest in the USA, Austria and Norway, at nearly €2,000 per year (Fig 13). However, if we take into account net annual income per capita, the cost burden of using a car (fuel, upkeep and insurance) looks very different. Americans spend the smallest proportion of their earnings on their vehicle (6.4% of their total annual budget). The figure is twice as high for their neighbours in Mexico (13.3%). In France, motorists spend 7.7% of their annual budget on their vehicle.
Fig 13 – Annual breakdown of vehicle operating costs
Download this infographic for your presentations The infographic shows the breakdown of annual vehicle usage costs for people who own at least one car, expressed in euros.
Three categories of expenditure are distinguished:
– Fuel
– Maintenance and repairs
– Insurance
Two reference values are shown (fuel / maintenance / insurance):
– Europe average: €1,692, €553, €572
– 18-country average: €1,598, €583, €572
Country data (fuel / maintenance / insurance / total annual):
Germany: 1,835 / 592 / 528 → total 2,955
Austria: 1,810 / 575 / 470 → total 2,855
Belgium: 1,981 / 704 / 429 → total 3,114
Spain: 1,736 / 575 / 429 → total 2,740
France: 1,745 / 579 / 557 → total 2,881
Italy: 1,619 / 468 / 557 → total 2,644
Norway: 1,901 / 757 / 770 → total 3,428
Netherlands: 1,698 / 623 / 618 → total 2,939
Poland: 1,341 / 326 / 281 → total 1,948
Portugal: 1,452 / 469 / 337 → total 2,258
United Kingdom: 1,488 / 480 / 520 → total 2,488
Turkey: 1,447 / 345 / 304 → total 2,096
South Africa: 1,581 / 650 / 726 → total 2,957
Japan: 1,103 / 901 / 410 → total 2,414
China: 1,373 / 717 / 615 → total 2,705
United States: 1,979 / 702 / 848 → total 3,529
Mexico: 1,262 / 529 / 486 → total 2,277
Brazil: 1,235 / 588 / 433 → total 2,256
Fuel is consistently the largest cost component.
The United States, Norway, and Belgium show the highest annual totals.
Poland, Brazil, and Mexico have the lowest annual costs.
Maintenance expenses vary widely across countries (from ~€326 in Poland to €901 in Japan).
Source: Observatoire Cetelem 2023
The infographic shows the breakdown of annual vehicle usage costs for people who own at least one car, expressed in euros.
Three categories of expenditure are distinguished:
– Fuel
– Maintenance and repairs
– Insurance
Two reference values are shown (fuel / maintenance / insurance):
– Europe average: €1,692, €553, €572
– 18-country average: €1,598, €583, €572
Country data (fuel / maintenance / insurance / total annual):
Germany: 1,835 / 592 / 528 → total 2,955
Austria: 1,810 / 575 / 470 → total 2,855
Belgium: 1,981 / 704 / 429 → total 3,114
Spain: 1,736 / 575 / 429 → total 2,740
France: 1,745 / 579 / 557 → total 2,881
Italy: 1,619 / 468 / 557 → total 2,644
Norway: 1,901 / 757 / 770 → total 3,428
Netherlands: 1,698 / 623 / 618 → total 2,939
Poland: 1,341 / 326 / 281 → total 1,948
Portugal: 1,452 / 469 / 337 → total 2,258
United Kingdom: 1,488 / 480 / 520 → total 2,488
Turkey: 1,447 / 345 / 304 → total 2,096
South Africa: 1,581 / 650 / 726 → total 2,957
Japan: 1,103 / 901 / 410 → total 2,414
China: 1,373 / 717 / 615 → total 2,705
United States: 1,979 / 702 / 848 → total 3,529
Mexico: 1,262 / 529 / 486 → total 2,277
Brazil: 1,235 / 588 / 433 → total 2,256
Fuel is consistently the largest cost component.
The United States, Norway, and Belgium show the highest annual totals.
Poland, Brazil, and Mexico have the lowest annual costs.
Maintenance expenses vary widely across countries (from ~€326 in Poland to €901 in Japan).
Source: Observatoire Cetelem 2023
An ever greater financial burden
Not only are cars expensive to run nowadays, but these costs continue to rise. More than 8 out of 10 respondents believe this to be the case, with only a tiny minority being of the view that running costs have fallen. In all the countries surveyed, the majority of respondents feel that the cost of using a car is on the up (Fig 14). Not surprisingly, given the economic circumstances they face, the Turks are very much of this opinion (95%). Almost as many South Africans agree. One has to go to Asia, specifically Japan and China, to find motorists who are less scathing in comparison, with just under 7 out of 10 respondents stating that motoring costs have increased.
Fig 14 – Evolution of vehicle usage costs
Download this infographic for your presentations The infographic shows the share of motorised respondents stating that the usage cost of their vehicle has fallen, remained stable, or risen.
Three answer categories:
– Have fallen
– Have remained stable
– Have risen
Data (order: fallen / stable / risen):
Germany: 3 / 18 / 79
Austria: 2 / 12 / 86
Belgium: 2 / 17 / 81
Spain: 1 / 12 / 87
France: 3 / 14 / 83
Italy: 2 / 14 / 86
Norway: 6 / 23 / 71
Netherlands: 6 / 20 / 74
Poland: 1 / 10 / 89
Portugal: 3 / 11 / 86
United Kingdom: 3 / 13 / 84
Turkey: 4 / 30 / 95
South Africa: 5 / 28 / 91
Japan: 1 / 18 / 65
China: 2 / 12 / 86
United States: 1 / 7 / 91
Mexico: 2 / 12 / 86
Brazil: 2 / 7 / 91
Europe average: 3% / 14% / 83%
18-country average: 3% / 15% / 82%
The vast majority of respondents, regardless of country, believe that costs have increased.
Source: Observatoire Cetelem de l’Automobile 2023
The infographic shows the share of motorised respondents stating that the usage cost of their vehicle has fallen, remained stable, or risen.
Three answer categories:
– Have fallen
– Have remained stable
– Have risen
Data (order: fallen / stable / risen):
Germany: 3 / 18 / 79
Austria: 2 / 12 / 86
Belgium: 2 / 17 / 81
Spain: 1 / 12 / 87
France: 3 / 14 / 83
Italy: 2 / 14 / 86
Norway: 6 / 23 / 71
Netherlands: 6 / 20 / 74
Poland: 1 / 10 / 89
Portugal: 3 / 11 / 86
United Kingdom: 3 / 13 / 84
Turkey: 4 / 30 / 95
South Africa: 5 / 28 / 91
Japan: 1 / 18 / 65
China: 2 / 12 / 86
United States: 1 / 7 / 91
Mexico: 2 / 12 / 86
Brazil: 2 / 7 / 91
Europe average: 3% / 14% / 83%
18-country average: 3% / 15% / 82%
The vast majority of respondents, regardless of country, believe that costs have increased.
Source: Observatoire Cetelem de l’Automobile 2023
Depreciation: a hidden cost of motoring
Another way of considering vehicle budgets is to include not only running costs but also the losses incurred. With this in mind, vehicle depreciation emerges as the number one budget killer in European countries, depriving motorists of financial leeway when buying their next car. Depreciation is particularly high on the latest electric models, given the greater rate of obsolescence of innovative high-tech products (Fig 15).
Fig 15 – Breakdown of costs by type of powertrain
Download this infographic for your presentations The infographic shows the percentage breakdown of expenditure categories for four vehicle types:
– Diesel
– Petrol
– Hybrid
– Electric
The coloured segments correspond to six types of expenses:
– Interest
– Repairs, maintenance and tyres
– Insurance
– Fuel / energy
– Road taxes
– Depreciation
Data by vehicle type (in %):
Diesel
Interest: 6
Repairs / maintenance / tyres: 12
Insurance: 10
Fuel / energy: 17
Road taxes: 6
Depreciation: 49
Petrol
Interest: 6
Repairs / maintenance / tyres: 11
Insurance: 10
Fuel / energy: 23
Road taxes: 5
Depreciation: 45
Hybrid vehicles
Interest: 7
Repairs / maintenance / tyres: 11
Insurance: 10
Fuel / energy: 17
Road taxes: 4
Depreciation: 51
Electric vehicles
Interest: 7
Repairs / maintenance / tyres: 12
Insurance: 11
Fuel / energy: 10
Road taxes: 3
Depreciation: 57
Depreciation is the largest cost component for all powertrains.
Fuel makes up a particularly high share for petrol vehicles (23%).
Electric vehicles have the lowest fuel/energy share (10%) but the highest depreciation share (57%).
Source: LeasePlan 2021
The infographic shows the percentage breakdown of expenditure categories for four vehicle types:
– Diesel
– Petrol
– Hybrid
– Electric
The coloured segments correspond to six types of expenses:
– Interest
– Repairs, maintenance and tyres
– Insurance
– Fuel / energy
– Road taxes
– Depreciation
Data by vehicle type (in %):
Diesel
Interest: 6
Repairs / maintenance / tyres: 12
Insurance: 10
Fuel / energy: 17
Road taxes: 6
Depreciation: 49
Petrol
Interest: 6
Repairs / maintenance / tyres: 11
Insurance: 10
Fuel / energy: 23
Road taxes: 5
Depreciation: 45
Hybrid vehicles
Interest: 7
Repairs / maintenance / tyres: 11
Insurance: 10
Fuel / energy: 17
Road taxes: 4
Depreciation: 51
Electric vehicles
Interest: 7
Repairs / maintenance / tyres: 12
Insurance: 11
Fuel / energy: 10
Road taxes: 3
Depreciation: 57
Depreciation is the largest cost component for all powertrains.
Fuel makes up a particularly high share for petrol vehicles (23%).
Electric vehicles have the lowest fuel/energy share (10%) but the highest depreciation share (57%).
Source: LeasePlan 2021
Costs put people off
Broadly speaking, cost is an issue that affects mobility as a whole. Nearly 6 out of 10 people say they have previously decided not to travel because of the cost involved, regardless of the mode of transport used (Fig 16). In those countries with the least resilient economies, such as Turkey and South Africa, this proportion rises to almost 8 out of 10. The figure for France is close to the overall average.
Fig 16 – Cutting back on travel due to cost
Download this infographic for your presentations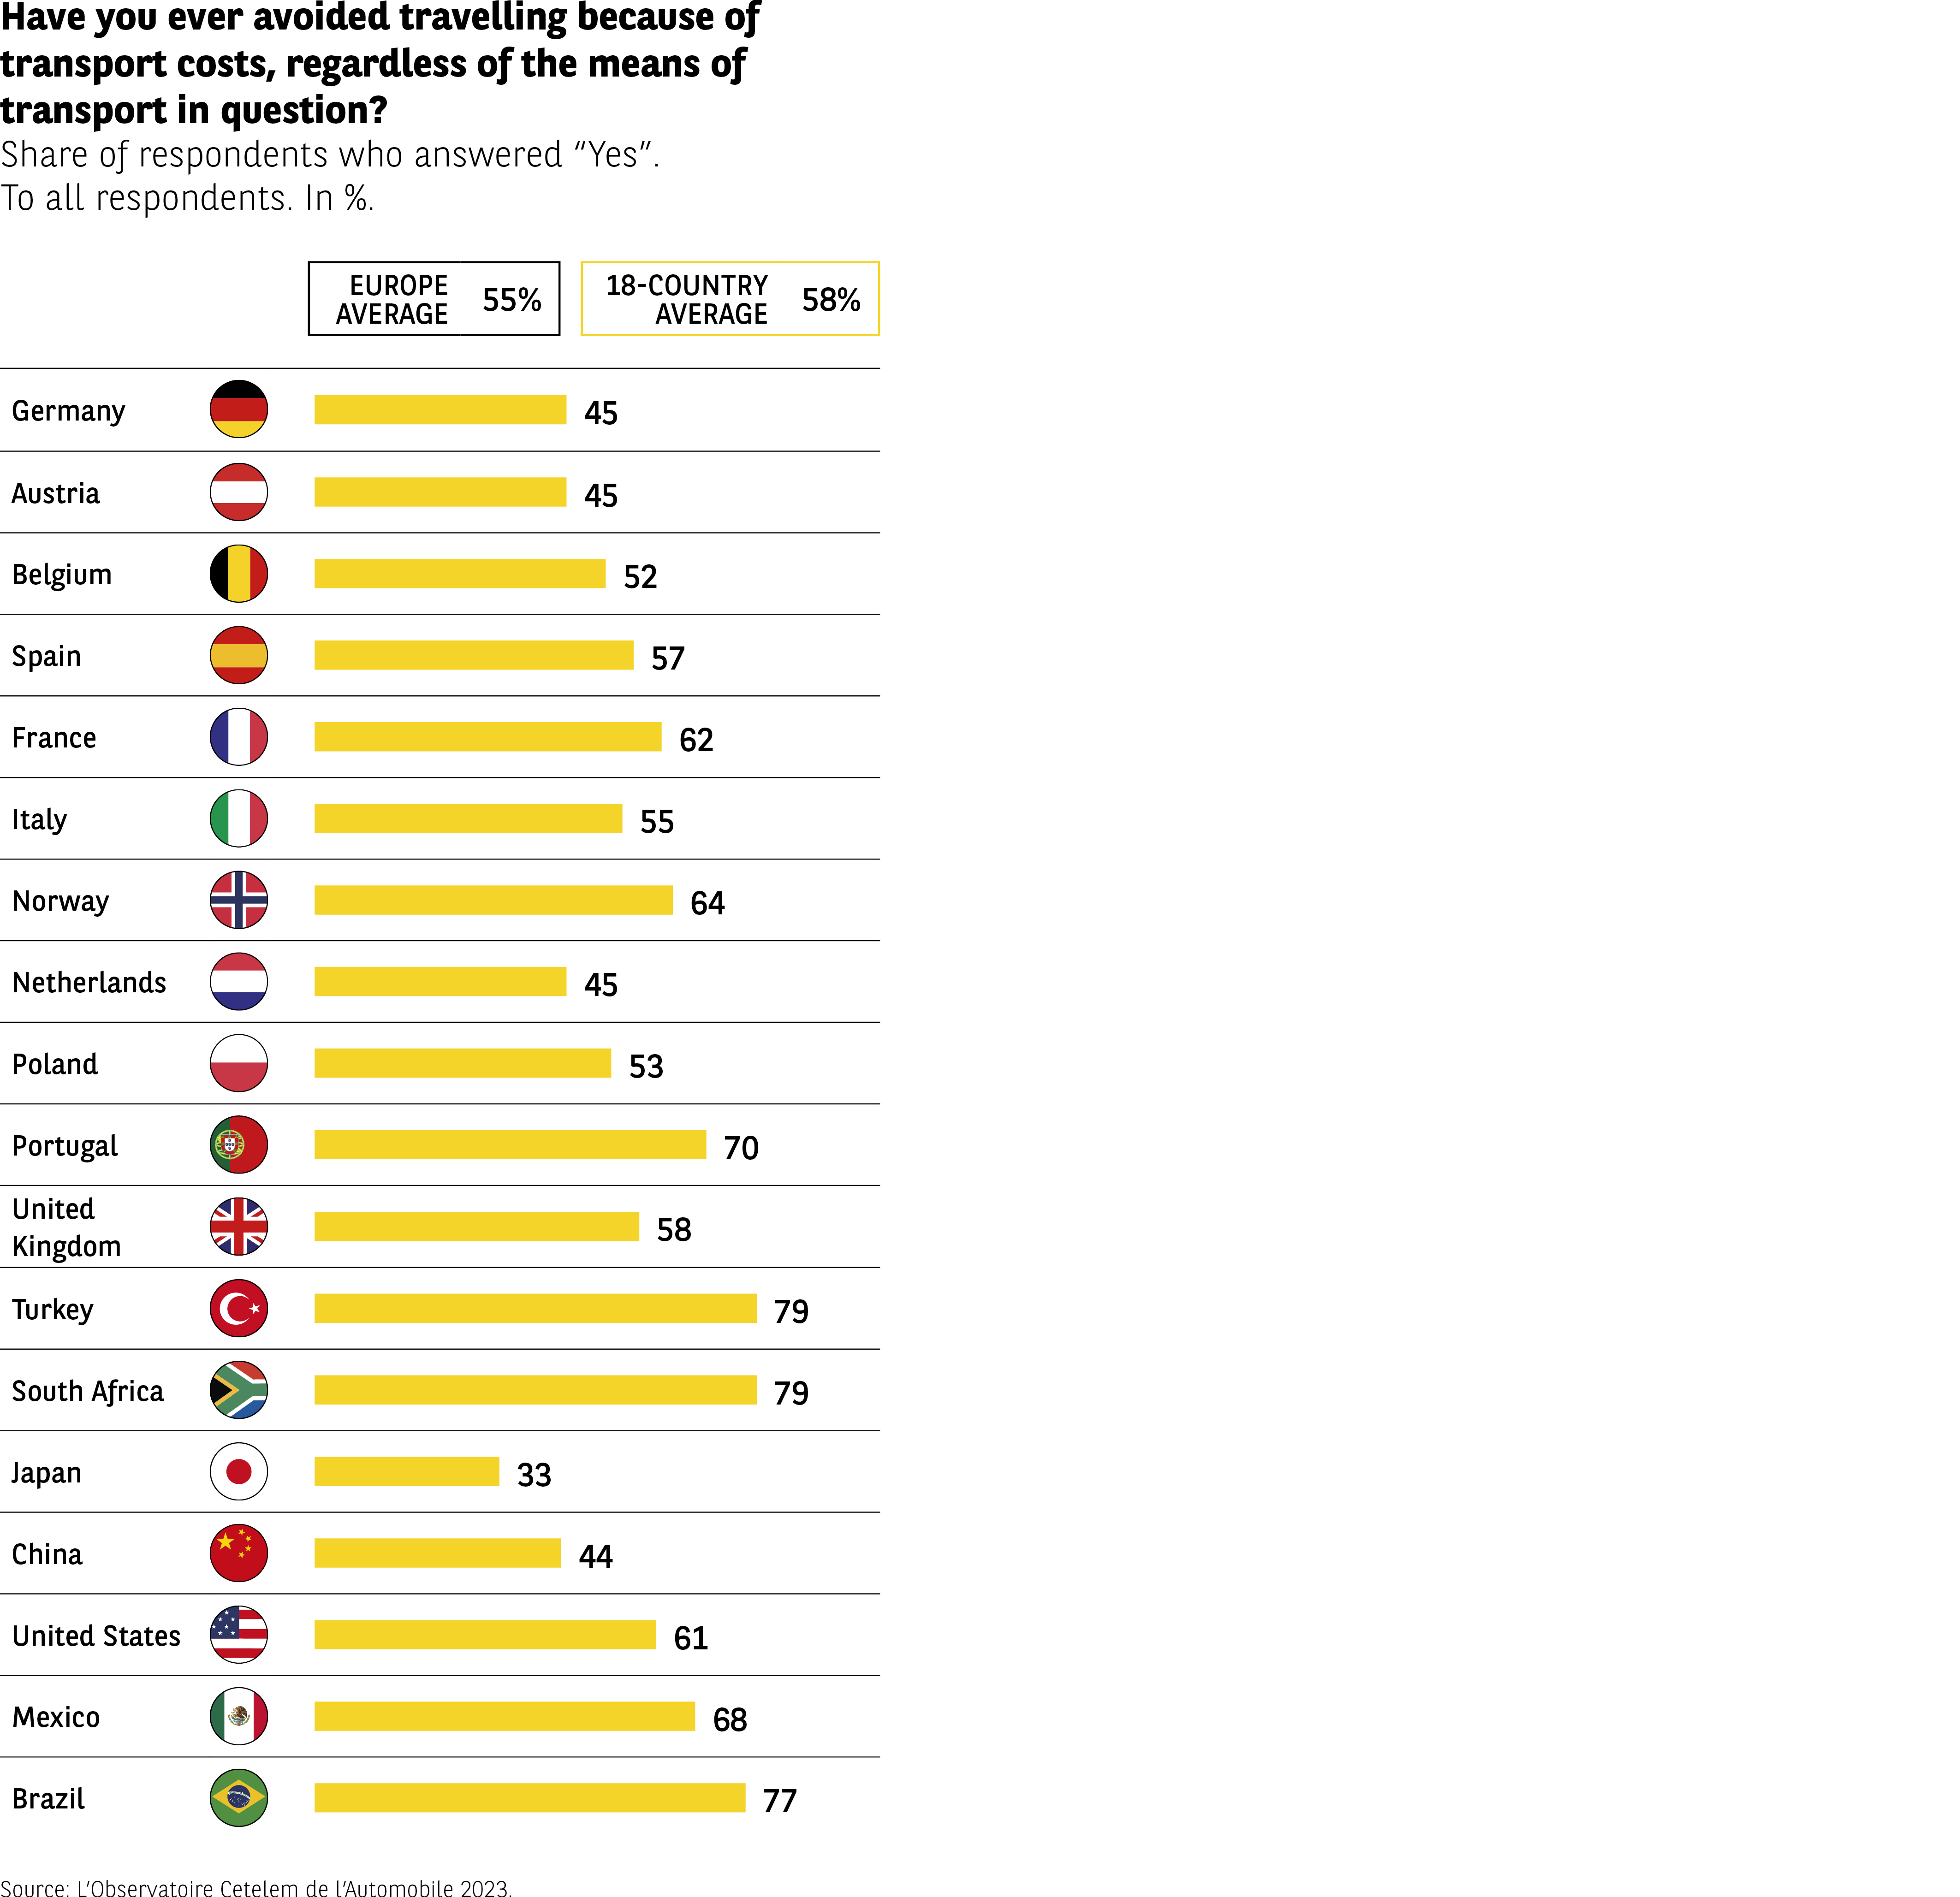 The infographic represents the proportion of respondents who claim to have given up a trip because of transportation costs in 18 countries.
Data (in %):
Germany 45%
Austria 45%
Belgium 52%
Spain 57%
France 62%
Italy 55%
Norway 64%
Netherlands 45%
Poland 53%
Portugal 70%
United Kingdom 58%
Turkey 79%
South Africa 79%
Japan 33%
China 44%
United States 61%
Mexico 68%
Brazil 77%
European average: 55%
Average of 18 countries: 58%
In the majority of countries, more than half of respondents claim to have already given up traveling for financial reasons.
Source: Cetelem Automotive Observatory, 2023.
The infographic represents the proportion of respondents who claim to have given up a trip because of transportation costs in 18 countries.
Data (in %):
Germany 45%
Austria 45%
Belgium 52%
Spain 57%
France 62%
Italy 55%
Norway 64%
Netherlands 45%
Poland 53%
Portugal 70%
United Kingdom 58%
Turkey 79%
South Africa 79%
Japan 33%
China 44%
United States 61%
Mexico 68%
Brazil 77%
European average: 55%
Average of 18 countries: 58%
In the majority of countries, more than half of respondents claim to have already given up traveling for financial reasons.
Source: Cetelem Automotive Observatory, 2023.
Insurance and upkeep, two costs that are still deemed reasonable
No insurance against high costs
Insurance is the number one item of expenditure examined by L’Observatoire Cetelem de l’Automobile 2023. Its cost is considered high by almost 1 in 2 respondents (Fig 17). At the risk of repetition – and this will not be the last time it occurs – the Turks are the most likely to describe this cost as excessive (71%), while the Germans are the least likely to do so (38%). The geographical breakdown of views on this topic reveals that a majority of respondents in several European countries believe that insurance is too expensive. This is notably the case in Belgium and Norway. Just over 1 in 2 French respondents are also of this belief.
Fig 17 – Perception of the cost of car insurance
Download this infographic for your presentations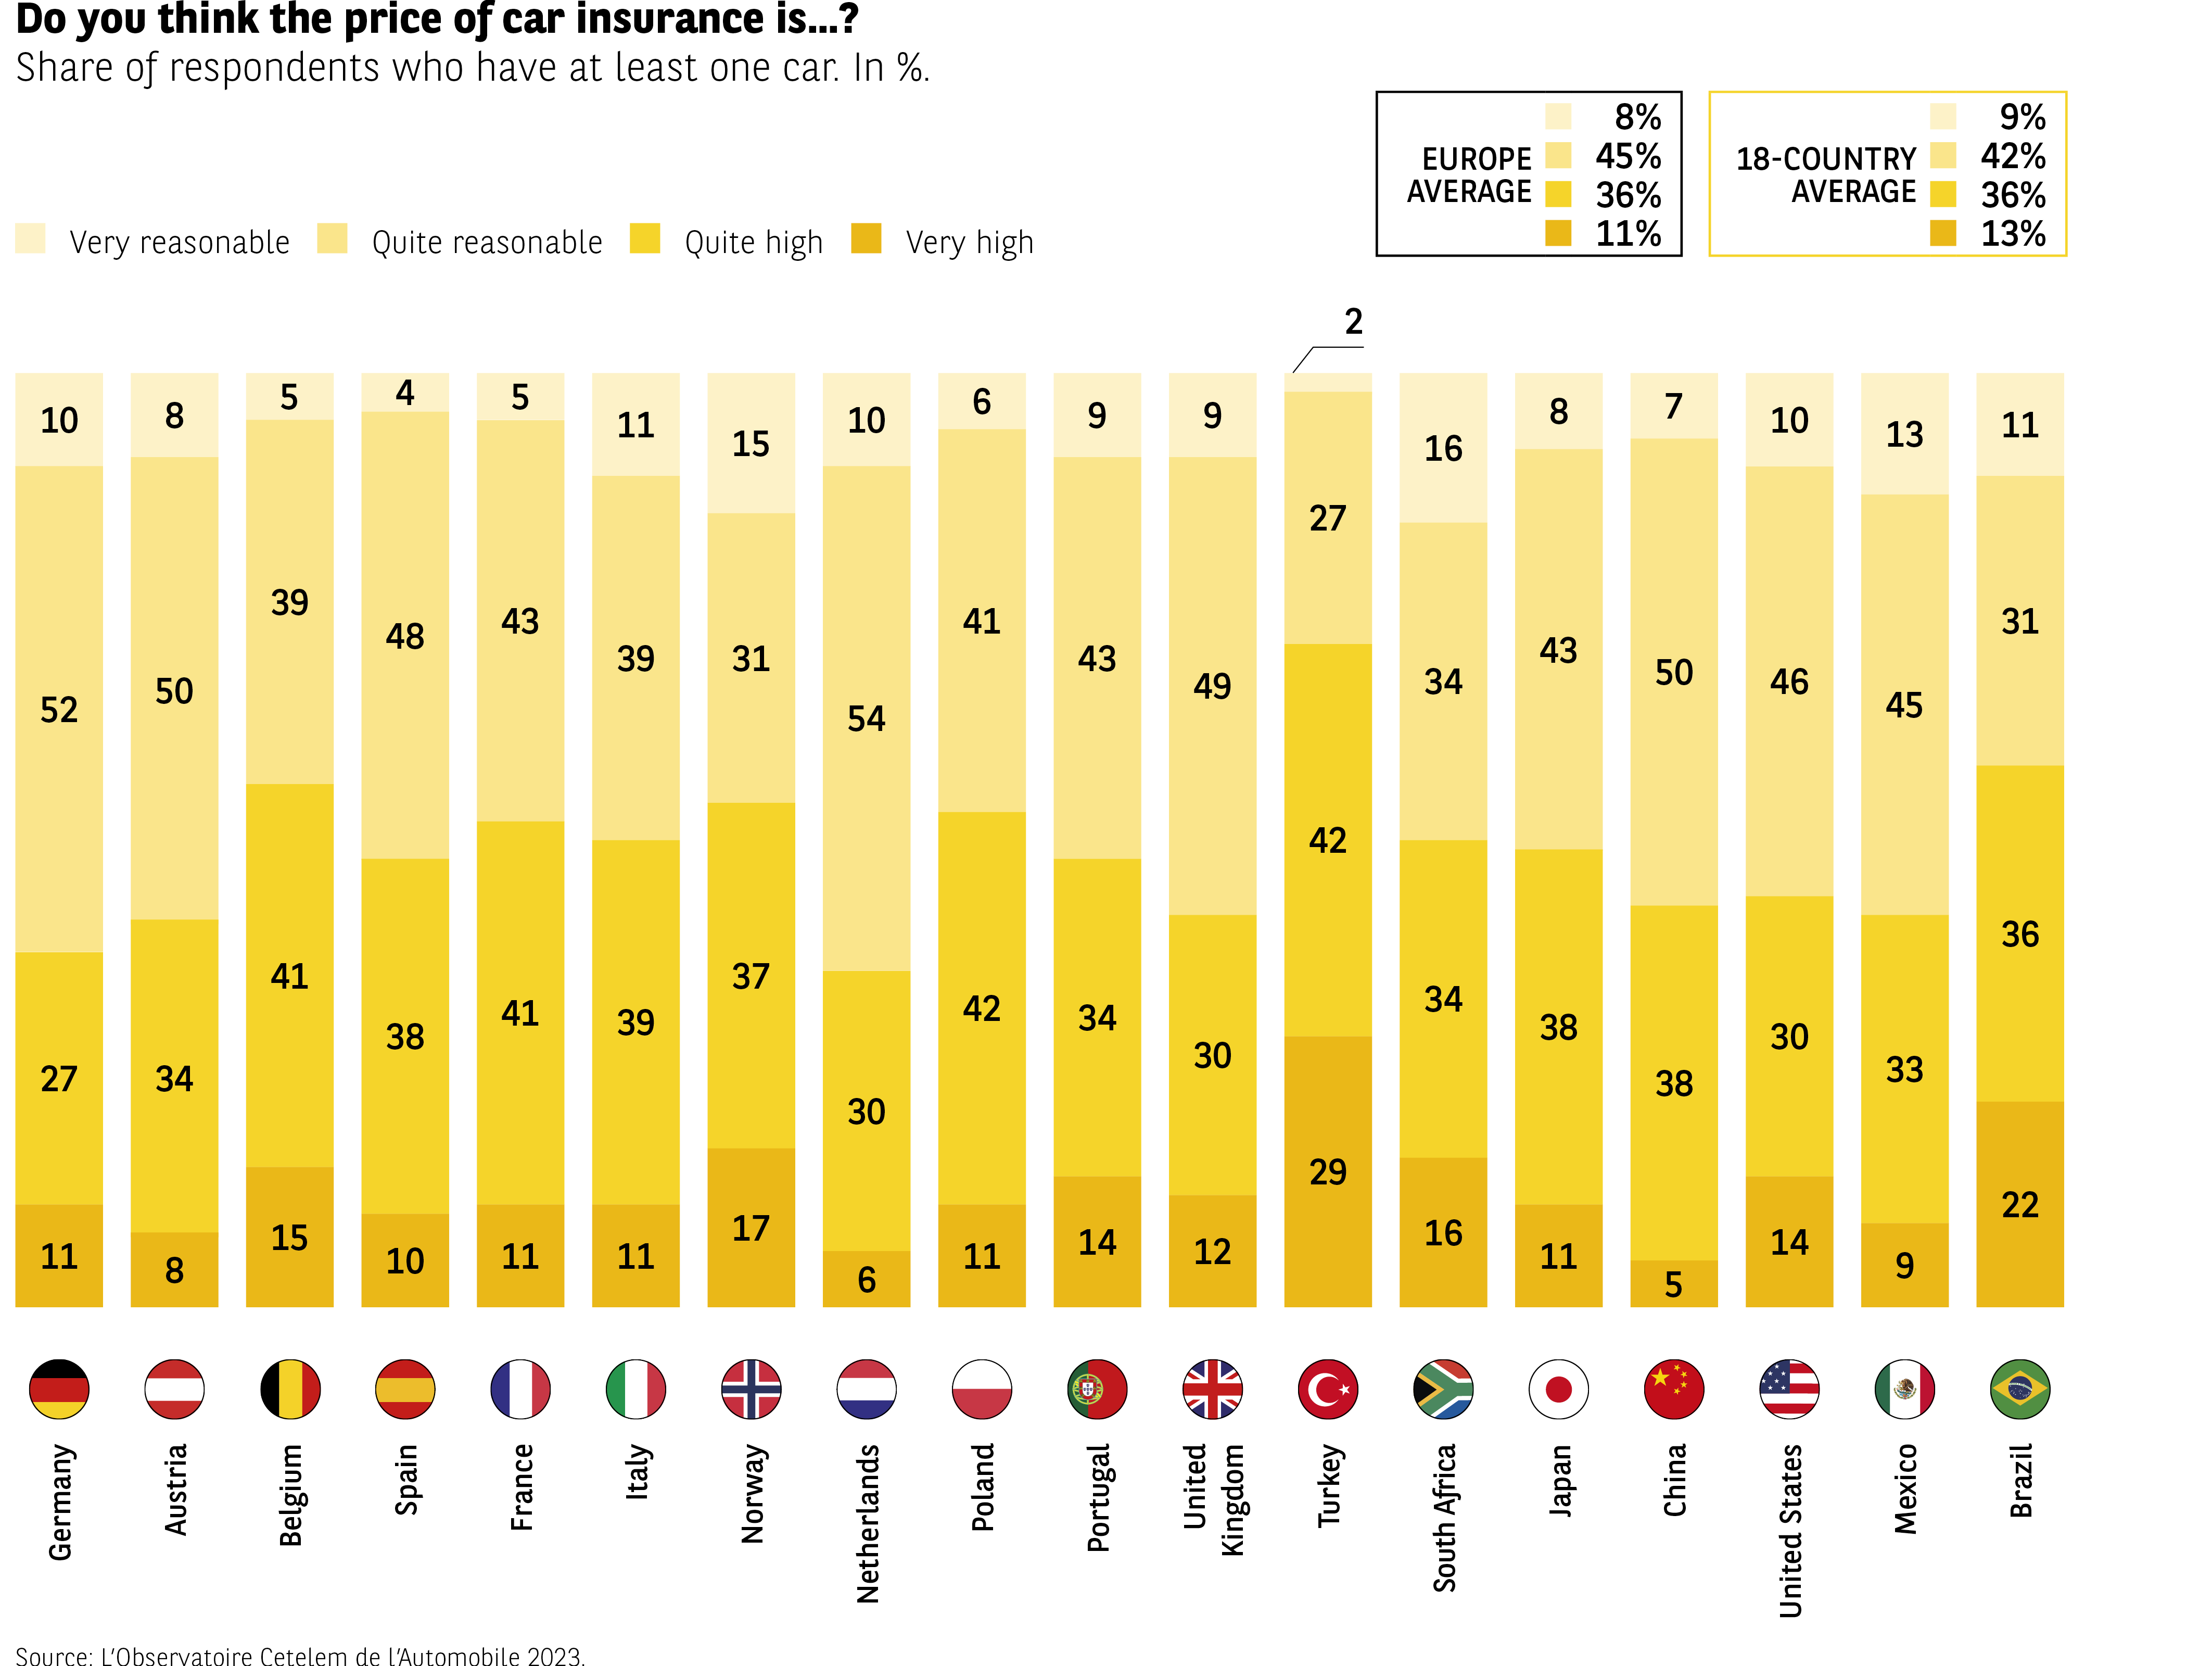 The infographic shows the perception of the annual cost of car insurance among people who own at least one car.
Four response options are provided:
– Very reasonable (VR)
– Rather reasonable (RR)
– Rather high (RH)
– Very high (VH)
Two averages are mentioned:
– European average: 8% / 45% / 36% / 11%
– Average of 18 countries: 9% / 42% / 36% / 13%
Data by country (in order of VR / RR / RH / VH):
Germany: 10 / 52 / 27 / 11
Austria: 8 / 50 / 34 / 8
Belgium: 5 / 48 / 38 / 15
Spain: 4 / 43 / 41 / 10
France: 5 / 39 / 41 / 11
Italy: 11 / 31 / 37 / 17
Norway: 15 / 54 / 30 / 6
Netherlands: 10 / 41 / 42 / 11
Poland: 9 / 43 / 34 / 14
Portugal: 2 / 27 / 42 / 29
United Kingdom: 16 / 34 / 43 / 6
Turkey: 13 / 41 / 34 / 12
South Africa: 16 / 50 / 30 / 4
Japan: 7 / 46 / 38 / 11
China: 10 / 33 / 38 / 19
United States: 5 / 33 / 40 / 22
Mexico: 13 / 45 / 31 / 9
Brazil: 11 / 31 / 36 / 22
“Rather reasonable” or “rather high” dominate in most countries.
Portugal and the United States show higher levels of “very high”.
Norway and South Africa perceive insurance as more reasonable.
Source: Cetelem Automotive Observatory 2023.
The infographic shows the perception of the annual cost of car insurance among people who own at least one car.
Four response options are provided:
– Very reasonable (VR)
– Rather reasonable (RR)
– Rather high (RH)
– Very high (VH)
Two averages are mentioned:
– European average: 8% / 45% / 36% / 11%
– Average of 18 countries: 9% / 42% / 36% / 13%
Data by country (in order of VR / RR / RH / VH):
Germany: 10 / 52 / 27 / 11
Austria: 8 / 50 / 34 / 8
Belgium: 5 / 48 / 38 / 15
Spain: 4 / 43 / 41 / 10
France: 5 / 39 / 41 / 11
Italy: 11 / 31 / 37 / 17
Norway: 15 / 54 / 30 / 6
Netherlands: 10 / 41 / 42 / 11
Poland: 9 / 43 / 34 / 14
Portugal: 2 / 27 / 42 / 29
United Kingdom: 16 / 34 / 43 / 6
Turkey: 13 / 41 / 34 / 12
South Africa: 16 / 50 / 30 / 4
Japan: 7 / 46 / 38 / 11
China: 10 / 33 / 38 / 19
United States: 5 / 33 / 40 / 22
Mexico: 13 / 45 / 31 / 9
Brazil: 11 / 31 / 36 / 22
“Rather reasonable” or “rather high” dominate in most countries.
Portugal and the United States show higher levels of “very high”.
Norway and South Africa perceive insurance as more reasonable.
Source: Cetelem Automotive Observatory 2023.
And yet, there is no real correlation between the cost of insurance and the sense that one is paying too much for it. At almost €1,000 per year, Austrians incur the highest insurance costs, but they are among the least likely to consider the price excessive. At the other end of the scale, the Poles are among the most critical, despite paying the least for their policies. Once again, the French pay close to the average, with an annual spend of €579 (Fig 18).
The Austrians incur the second highest insurance costs relative to their income per capita, just ahead of the Mexicans (2.5% and 2.8%, respectively). The Poles bring up the rear in this ranking (1.1%).
Fig 18 – Annual cost of car insurance by country
Download this infographic for your presentations The infographic compares the average annual amount paid for car insurance in different countries. The values are in euros.
Displayed data (in €):
Germany: 528
Austria: 954
Belgium: 704
Spain: 429
France: 579
Italy: 557
Norway: 770
Netherlands: 618
Poland: 281
Portugal: 337
United Kingdom: 520
Turkey: 304
South Africa: 726
Japan: 410
China: 615
United States: 848
Mexico: 486
Brazil: 433
The costs vary greatly from country to country: Austria and the United States have the highest amounts, while Poland and Turkey have the lowest levels.
Source: Cetelem Automotive Observatory 2023.
The infographic compares the average annual amount paid for car insurance in different countries. The values are in euros.
Displayed data (in €):
Germany: 528
Austria: 954
Belgium: 704
Spain: 429
France: 579
Italy: 557
Norway: 770
Netherlands: 618
Poland: 281
Portugal: 337
United Kingdom: 520
Turkey: 304
South Africa: 726
Japan: 410
China: 615
United States: 848
Mexico: 486
Brazil: 433
The costs vary greatly from country to country: Austria and the United States have the highest amounts, while Poland and Turkey have the lowest levels.
Source: Cetelem Automotive Observatory 2023.
Is the increase in car insurance prices set to be reversed?
Having risen for six years in a row, car insurance premiums fell slightly in France in 2021, saving motorists an average of €9 compared with the previous year (Fig 19). While the constant rise observed since 2016 was caused primarily by the soaring price of spare parts and the passing on of additional costs relating to other types of insurance (direct or indirect consequences of natural disasters, Covid, etc.), the reason for the fall recorded in 2021 is altogether different. Indeed, the global health crisis, the travel restrictions to which it led and the widescale adoption of remote working have contributed to a significant reduction in traffic volumes and, therefore, in the number of insurance claims and payouts. There has also been growing competitive pressure within the car insurance sector, with the arrival of new entrants who are cutting prices by applying new “pay as you drive” or “pay how you drive” models, where rates depend on the amount a car is used or the owner’s driving style.
Fig 19 – Evolution of the annual car insurance premium
Download this infographic for your presentations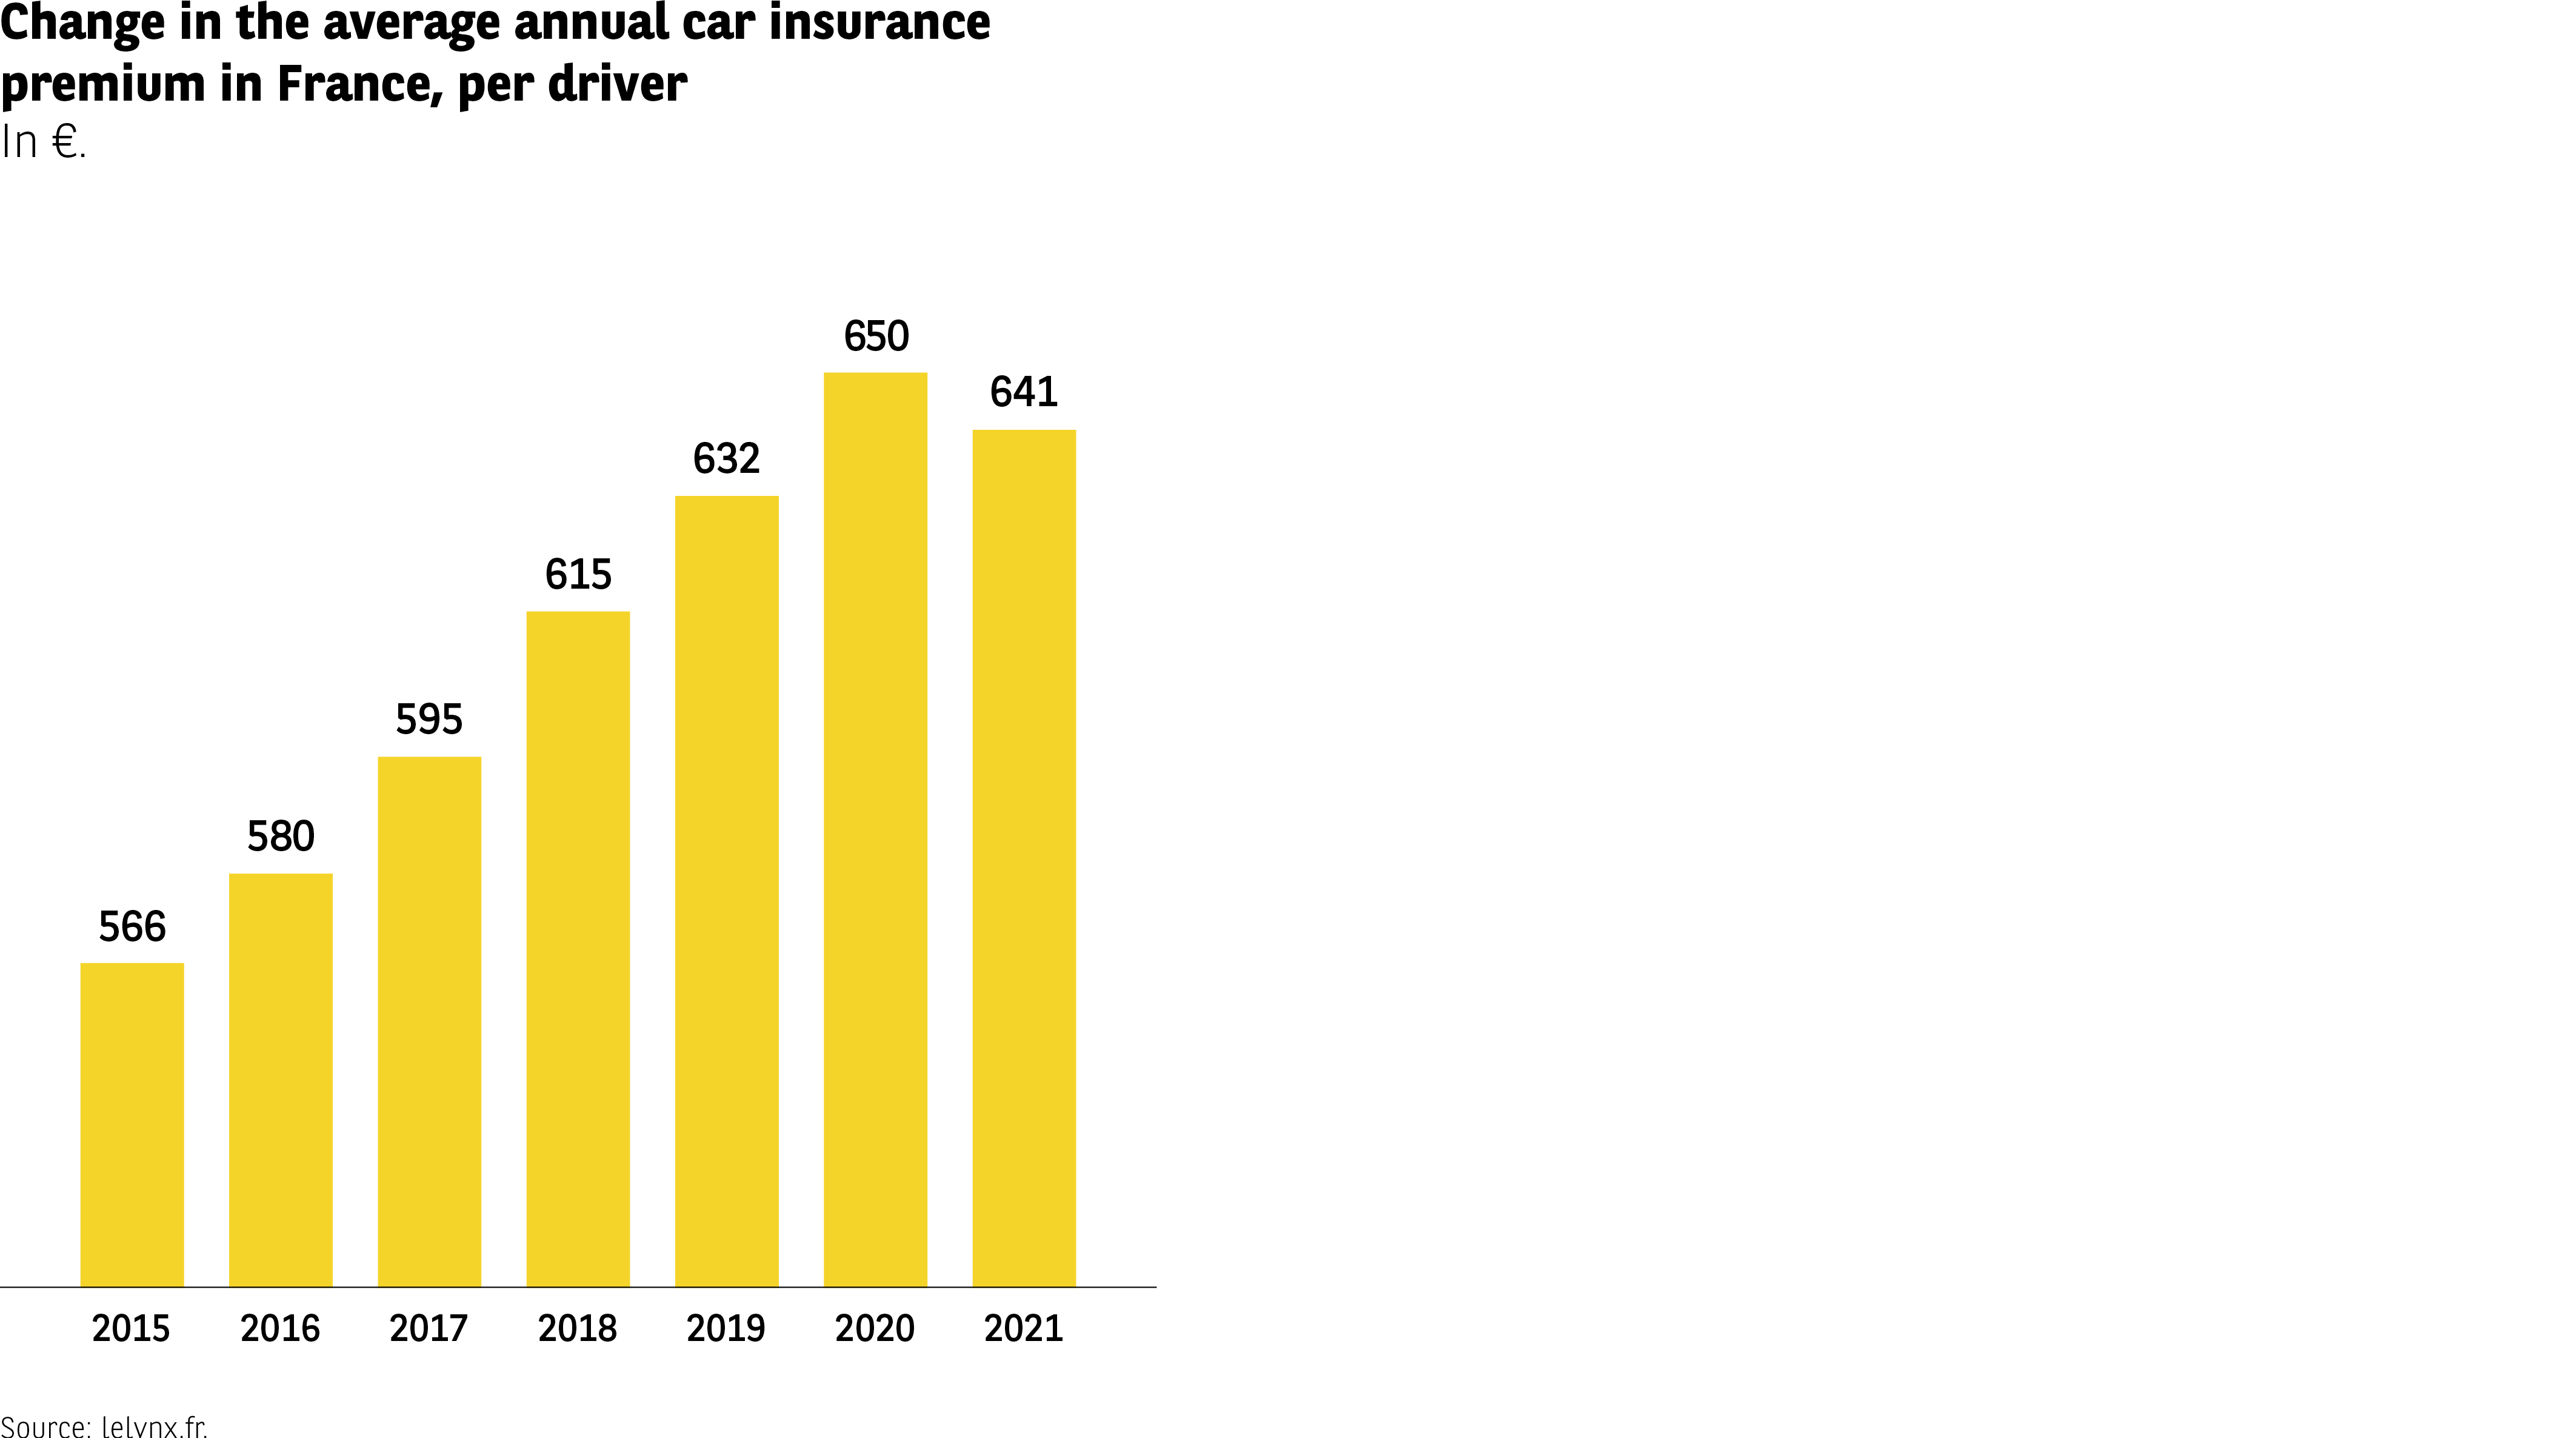 The graph presents the evolution of the average annual amount of car insurance premiums in France, expressed in euros, between 2015 and 2021.
Displayed data:
2015: €566
2016: €580
2017: €595
2018: €615
2019: $632
2020: €650
2021: €641
The average premium increases regularly from 2015 to 2020, before a slight decrease in 2021, while still remaining above the levels at the beginning of the period.
Source: lelynx.fr
The graph presents the evolution of the average annual amount of car insurance premiums in France, expressed in euros, between 2015 and 2021.
Displayed data:
2015: €566
2016: €580
2017: €595
2018: €615
2019: $632
2020: €650
2021: €641
The average premium increases regularly from 2015 to 2020, before a slight decrease in 2021, while still remaining above the levels at the beginning of the period.
Source: lelynx.fr
Repairs: a lesser evil
When it comes to upkeep and repairs, the second biggest expense item for vehicle owners, the views of motorists are more measured, with just over 4 in 10 deeming their cost too high (Fig 20). Once again, the Turks top the list (72%), followed this time by the Japanese, who are also up in arms about high prices. Meanwhile, the Americans and the Brits do not appear to suffer excessively from the financial outlay involved (30% and 34%). What of the French? They fall into line with the average, of course.
Fig 20 – Perception of the annual ‘maintenance-repair’ cost of a vehicle
Download this infographic for your presentations The infographic shows how car owners evaluate the annual cost of maintaining and repairing their vehicle.
The responses are grouped into four categories:
– Very reasonable (VR)
– Rather reasonable (RR)
– Rather high (RH)
– Very high (VH)
Main data by country (in % – VR / RR / RH / VH):
Germany: 12 / 52 / 26 / 10
Austria: 11 / 52 / 28 / 9
Belgium: 9 / 45 / 34 / 12
Spain: 9 / 43 / 38 / 10
France: 11 / 44 / 34 / 11
Italy: 11 / 46 / 34 / 9
Norway: 20 / 36 / 28 / 16
Netherlands: 14 / 53 / 28 / 5
Poland: 10 / 47 / 32 / 11
Portugal: 15 / 51 / 24 / 10
United Kingdom: 13 / 43 / 30 / 14
Turkey: 26 / 42 / 30 / 30
South Africa: 13 / 47 / 32 / 16
Japan: 9 / 47 / 28 / 13
China: 11 / 47 / 20 / 4
United States: 11 / 31 / 39 / 19
Mexico: 10 / 49 / 31 / 9
Brazil: 10 / 37 / 35 / 18
In most countries, the cost is perceived as “rather reasonable” or “rather high”. Some countries (Turkey, South Africa, Brazil) have a higher proportion of “very high” opinions.
Sources: Cetelem Automotive Observatory 2023.
The infographic shows how car owners evaluate the annual cost of maintaining and repairing their vehicle.
The responses are grouped into four categories:
– Very reasonable (VR)
– Rather reasonable (RR)
– Rather high (RH)
– Very high (VH)
Main data by country (in % – VR / RR / RH / VH):
Germany: 12 / 52 / 26 / 10
Austria: 11 / 52 / 28 / 9
Belgium: 9 / 45 / 34 / 12
Spain: 9 / 43 / 38 / 10
France: 11 / 44 / 34 / 11
Italy: 11 / 46 / 34 / 9
Norway: 20 / 36 / 28 / 16
Netherlands: 14 / 53 / 28 / 5
Poland: 10 / 47 / 32 / 11
Portugal: 15 / 51 / 24 / 10
United Kingdom: 13 / 43 / 30 / 14
Turkey: 26 / 42 / 30 / 30
South Africa: 13 / 47 / 32 / 16
Japan: 9 / 47 / 28 / 13
China: 11 / 47 / 20 / 4
United States: 11 / 31 / 39 / 19
Mexico: 10 / 49 / 31 / 9
Brazil: 10 / 37 / 35 / 18
In most countries, the cost is perceived as “rather reasonable” or “rather high”. Some countries (Turkey, South Africa, Brazil) have a higher proportion of “very high” opinions.
Sources: Cetelem Automotive Observatory 2023.
Judging by the cost of vehicle repairs and the proportion of average income that they represent, the Japanese seem to have good reason to be annoyed. With a mean spend of €901 per year, they are well ahead of every other country, followed at a distance by the Norwegians and the Austrians. Once more, the Poles spend the least of all the populations surveyed (€326), but the Turks are only just ahead of them in terms of expenditure (Fig 21).
If we look at the repairs-to-income ratio, the Japanese sit in second place, with the Mexicans taking the lead once again (2.7% and 3.1% respectively). And we find the same two countries at the foot of the ranking: Poland and the United States.
It should also be noted that spending on repairs is very similar regardless of whether vehicles are bought new or used. New cars are usually booked in for regular servicing at dealerships, which comes at a cost, while second-hand vehicles tend to be repaired more frequently, but at cheaper prices.
Fig 21 – Annual ‘maintenance-repair’ cost by country
Download this infographic for your presentations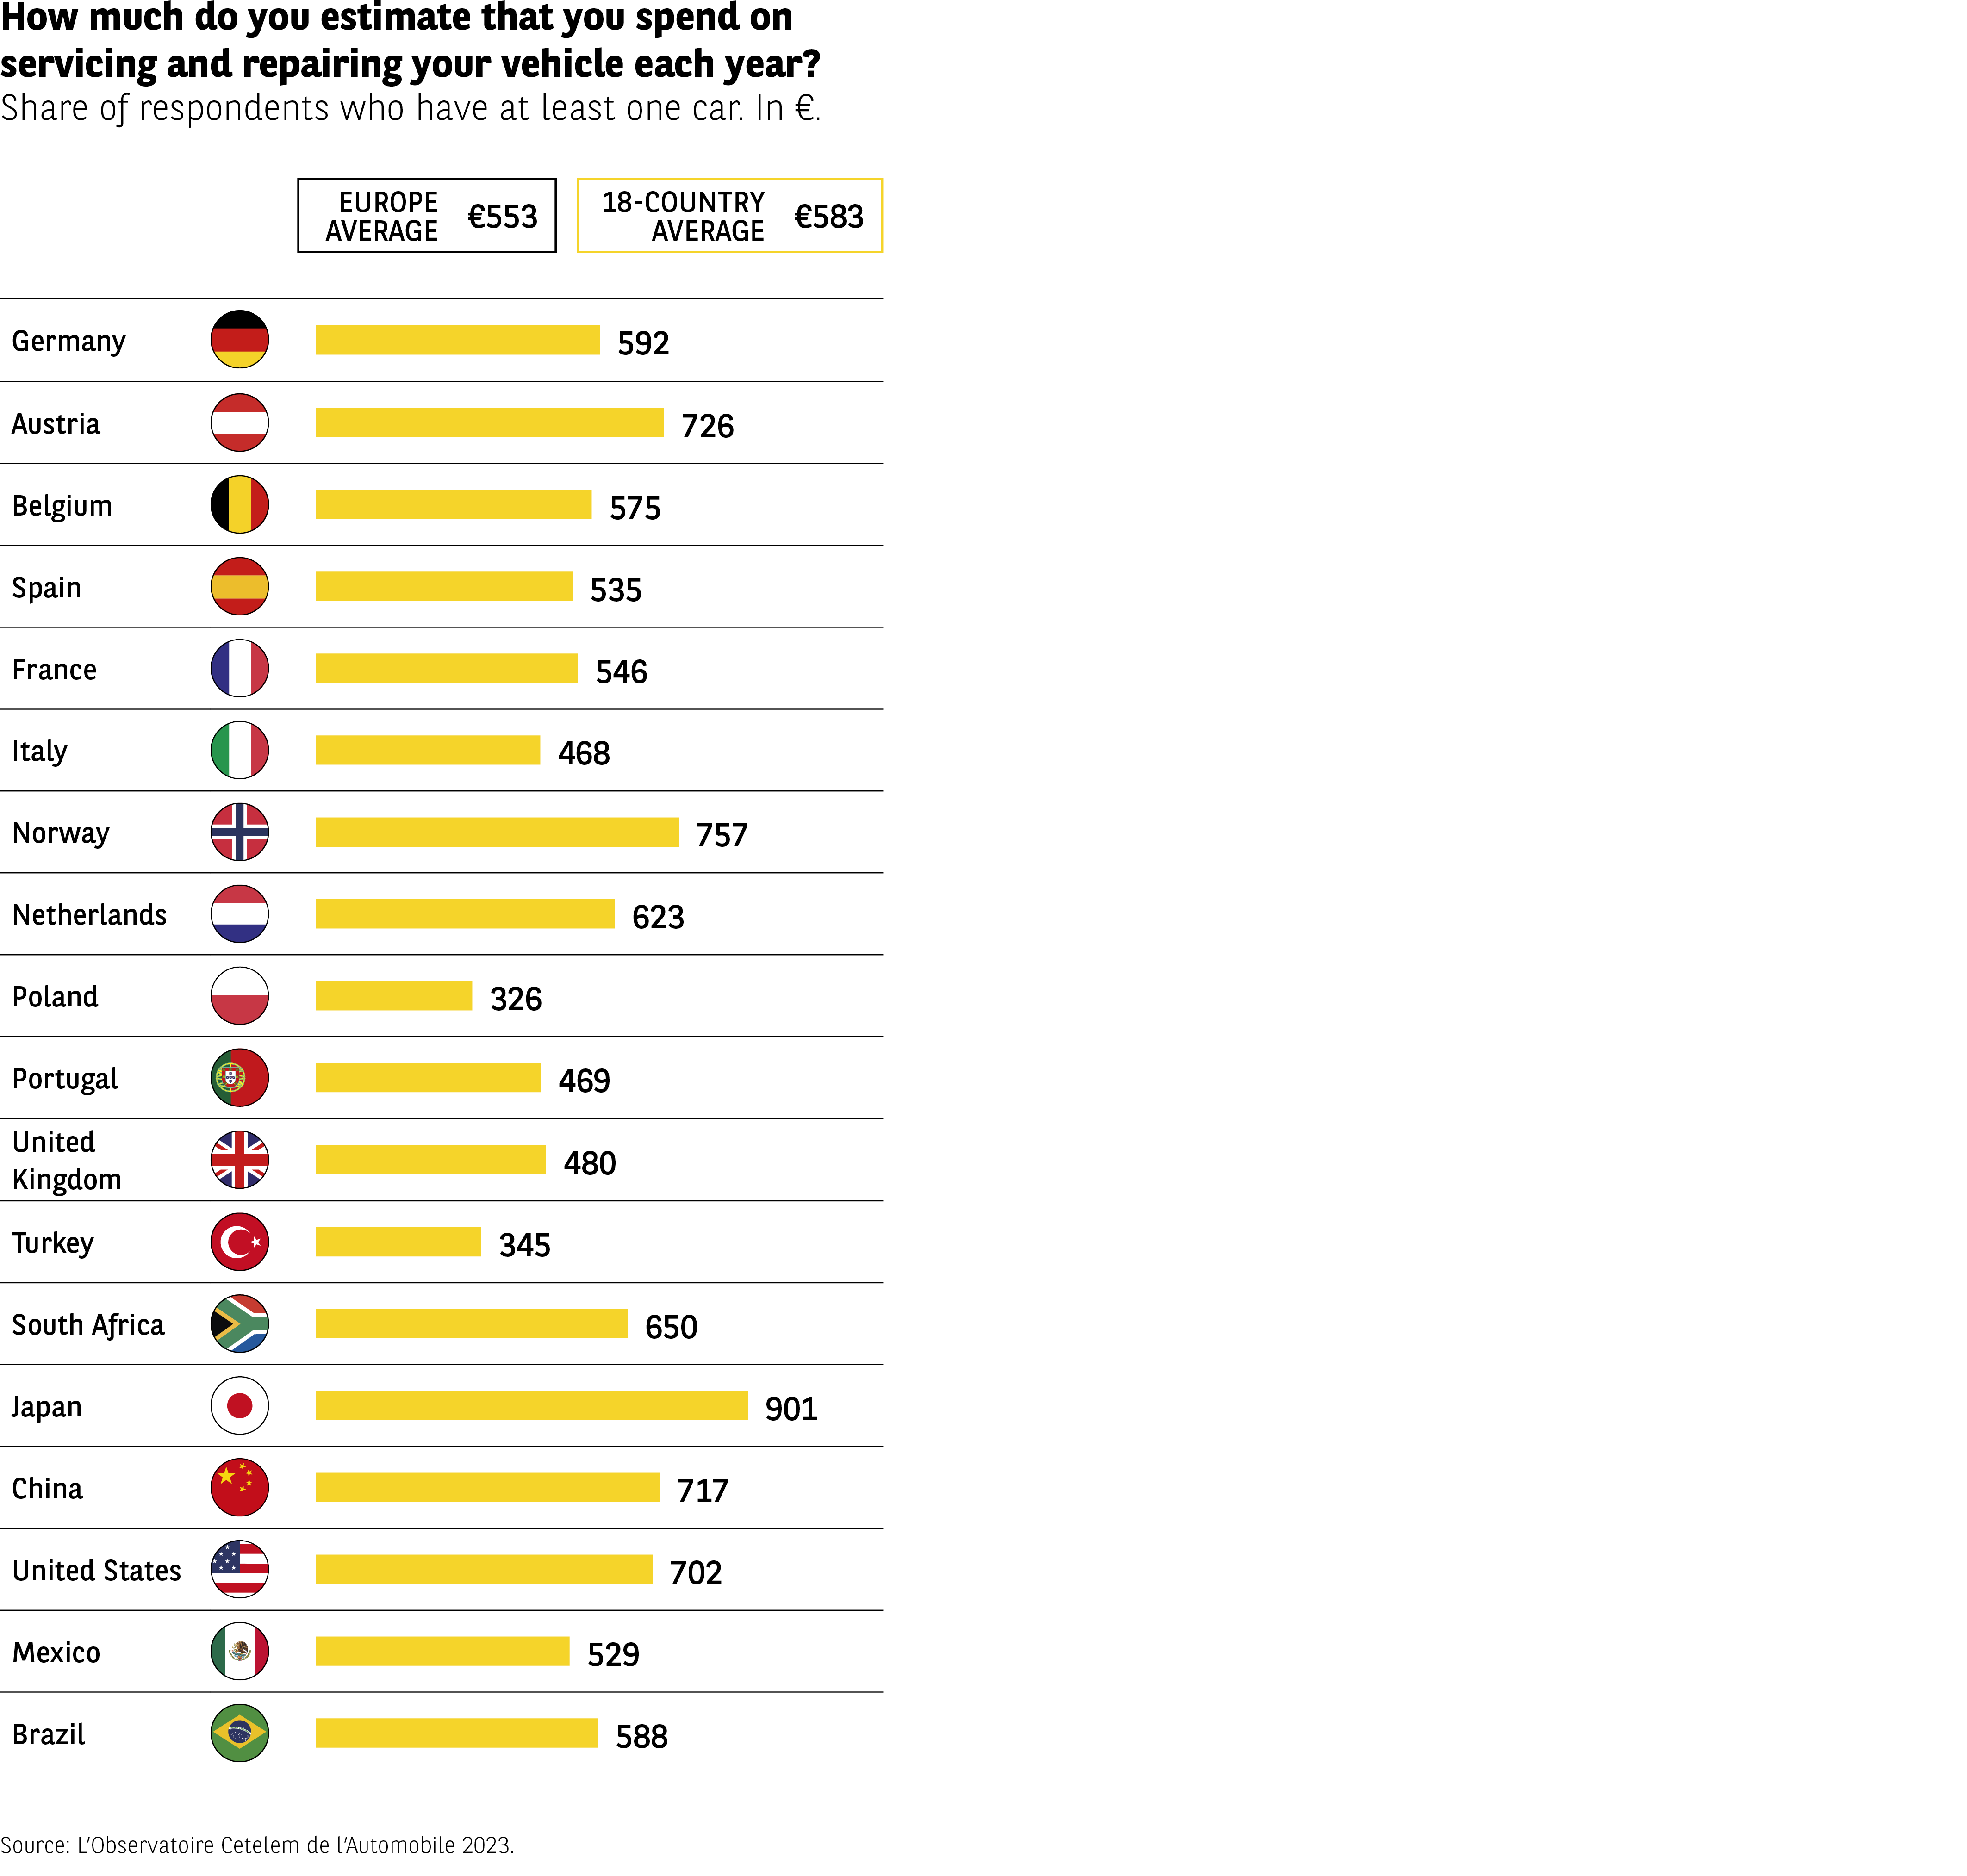 The infographic presents the annual cost of vehicle maintenance and repairs in 18 countries. The values are expressed in euros and calculated based on respondents who own at least one car.
Two benchmarks are provided:
– European average: €553
– 18-country average: €583
Displayed data (in €):
Germany: €592
Austria: €726
Belgium: €575
Spain: €535
France: €546
Italy: €468
Norway: €757
Netherlands: €623
Poland: €326
Portugal: €469
United Kingdom: €480
Turkey: €345
South Africa: €650
Japan: €901
China: €717
United States: €702
Mexico: €529
Brazil: €588
The costs vary greatly from country to country. Japan, Norway, China, and the United States are among the highest, while Poland and Turkey have the lowest levels.
Source: Cetelem Automotive Observatory 2023.
The infographic presents the annual cost of vehicle maintenance and repairs in 18 countries. The values are expressed in euros and calculated based on respondents who own at least one car.
Two benchmarks are provided:
– European average: €553
– 18-country average: €583
Displayed data (in €):
Germany: €592
Austria: €726
Belgium: €575
Spain: €535
France: €546
Italy: €468
Norway: €757
Netherlands: €623
Poland: €326
Portugal: €469
United Kingdom: €480
Turkey: €345
South Africa: €650
Japan: €901
China: €717
United States: €702
Mexico: €529
Brazil: €588
The costs vary greatly from country to country. Japan, Norway, China, and the United States are among the highest, while Poland and Turkey have the lowest levels.
Source: Cetelem Automotive Observatory 2023.
Spare parts prices skyrocket
It isn’t just cars that are becoming more expensive every year: spare parts prices are rising too. Several coinciding factors have contributed to an increase of almost 30% over the last decade (Fig 22). Vehicles are becoming better equipped and parts are increasingly sophisticated and complex to produce. Recent shortages (affecting electronic chips in particular), longer lead times and soaring raw material costs all explain the recent surge in prices. The monopoly enjoyed by automakers when it comes to spare parts is also regularly singled out as a cause of inflated prices for consumers. The liberalisation of the car parts market by the “Climate and Resilience” Act of 22 August 2021 could help reverse the trend (in France). However, progress looks set to be slow and gradual, since the legislation will only cover the automotive glass market as of January 2023. In the meantime, to help lighten the bill, consumers can rely on local mechanics. Indeed, since 2017 the latter have been required to provide an alternative quote based on the use of second-hand parts, which are obviously less expensive.
Fig 22 – Evolution of spare part prices in France
Download this infographic for your presentations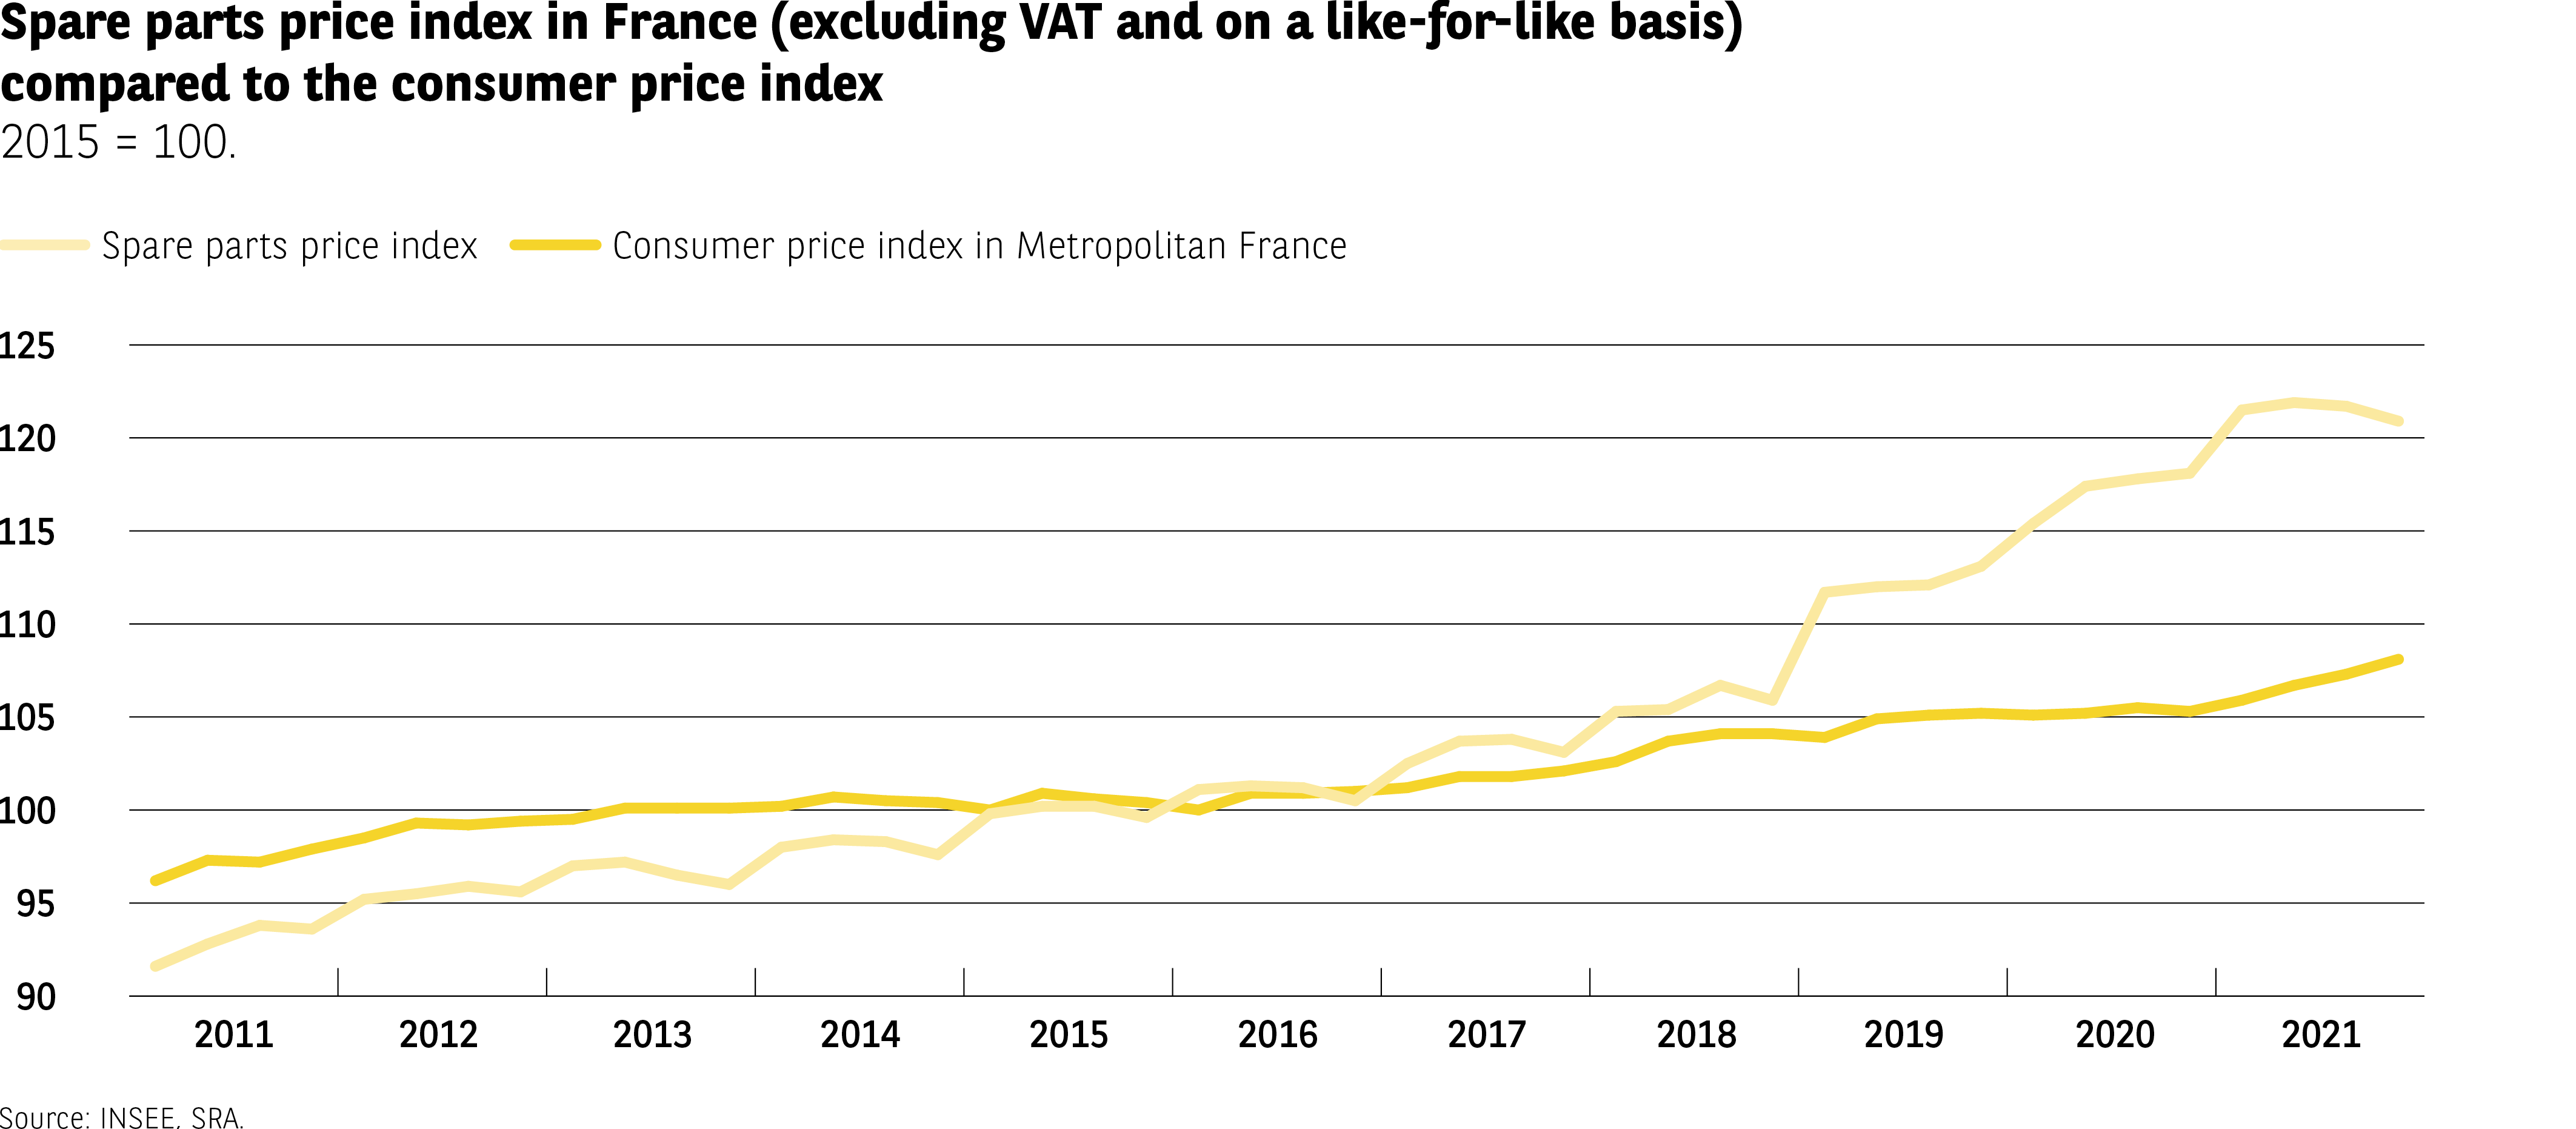 The infographic compares two indicators in France between 2011 and 2021, expressed in base 100 in 2015:
– the index of spare part prices (excluding VAT, constant model);
– the consumer price index in metropolitan France.
Vertical axis: scale from 90 to 125.
Horizontal axis: years from 2011 to 2021.
Data:
Spare part price index:
2011 ≈ €92
2012 ≈ €95
2013 ≈ €97
2014 ≈ €98
2015 = €100
2016 ≈ €101
2017 ≈ €104
2018 ≈ €105
2019 ≈ €112
2020 ≈ €118
2021 ≈ €122
Consumer price index:
2011 ≈ €96
2012 ≈ €98
2013 ≈ €100
2014 ≈ €101
2015 = €100
2016 ≈ €101
2017 ≈ €102
2018 ≈ €103
2019 ≈ €105
2020 ≈ €101
2021 ≈ €105
Both indices increase over the period, but the rise in spare part prices accelerates significantly from 2018, far exceeding general inflation.
Source: INSEE, SRA.
The infographic compares two indicators in France between 2011 and 2021, expressed in base 100 in 2015:
– the index of spare part prices (excluding VAT, constant model);
– the consumer price index in metropolitan France.
Vertical axis: scale from 90 to 125.
Horizontal axis: years from 2011 to 2021.
Data:
Spare part price index:
2011 ≈ €92
2012 ≈ €95
2013 ≈ €97
2014 ≈ €98
2015 = €100
2016 ≈ €101
2017 ≈ €104
2018 ≈ €105
2019 ≈ €112
2020 ≈ €118
2021 ≈ €122
Consumer price index:
2011 ≈ €96
2012 ≈ €98
2013 ≈ €100
2014 ≈ €101
2015 = €100
2016 ≈ €101
2017 ≈ €102
2018 ≈ €103
2019 ≈ €105
2020 ≈ €101
2021 ≈ €105
Both indices increase over the period, but the rise in spare part prices accelerates significantly from 2018, far exceeding general inflation.
Source: INSEE, SRA.
Fuelling the problem
Petrol, my dear!
While the cost of insurance and repairs is a matter for some debate, the same cannot be said for fuel. The findings are clear: 7 out of 10 motorists feel that their fuel budget is high (Fig 23). China is the only country surveyed in which this is not a majority-held view, although not by much, given that 49% of Chinese motorists agree with the suggestion. In every other country, it is unquestionable, especially in Turkey where 9 out of 10 people believe the cost is high. The Japanese and Mexicans are a little less vehement, although they are not as measured as the Chinese.
Fig 23 – Perception of the monthly fuel budget
Download this infographic for your presentations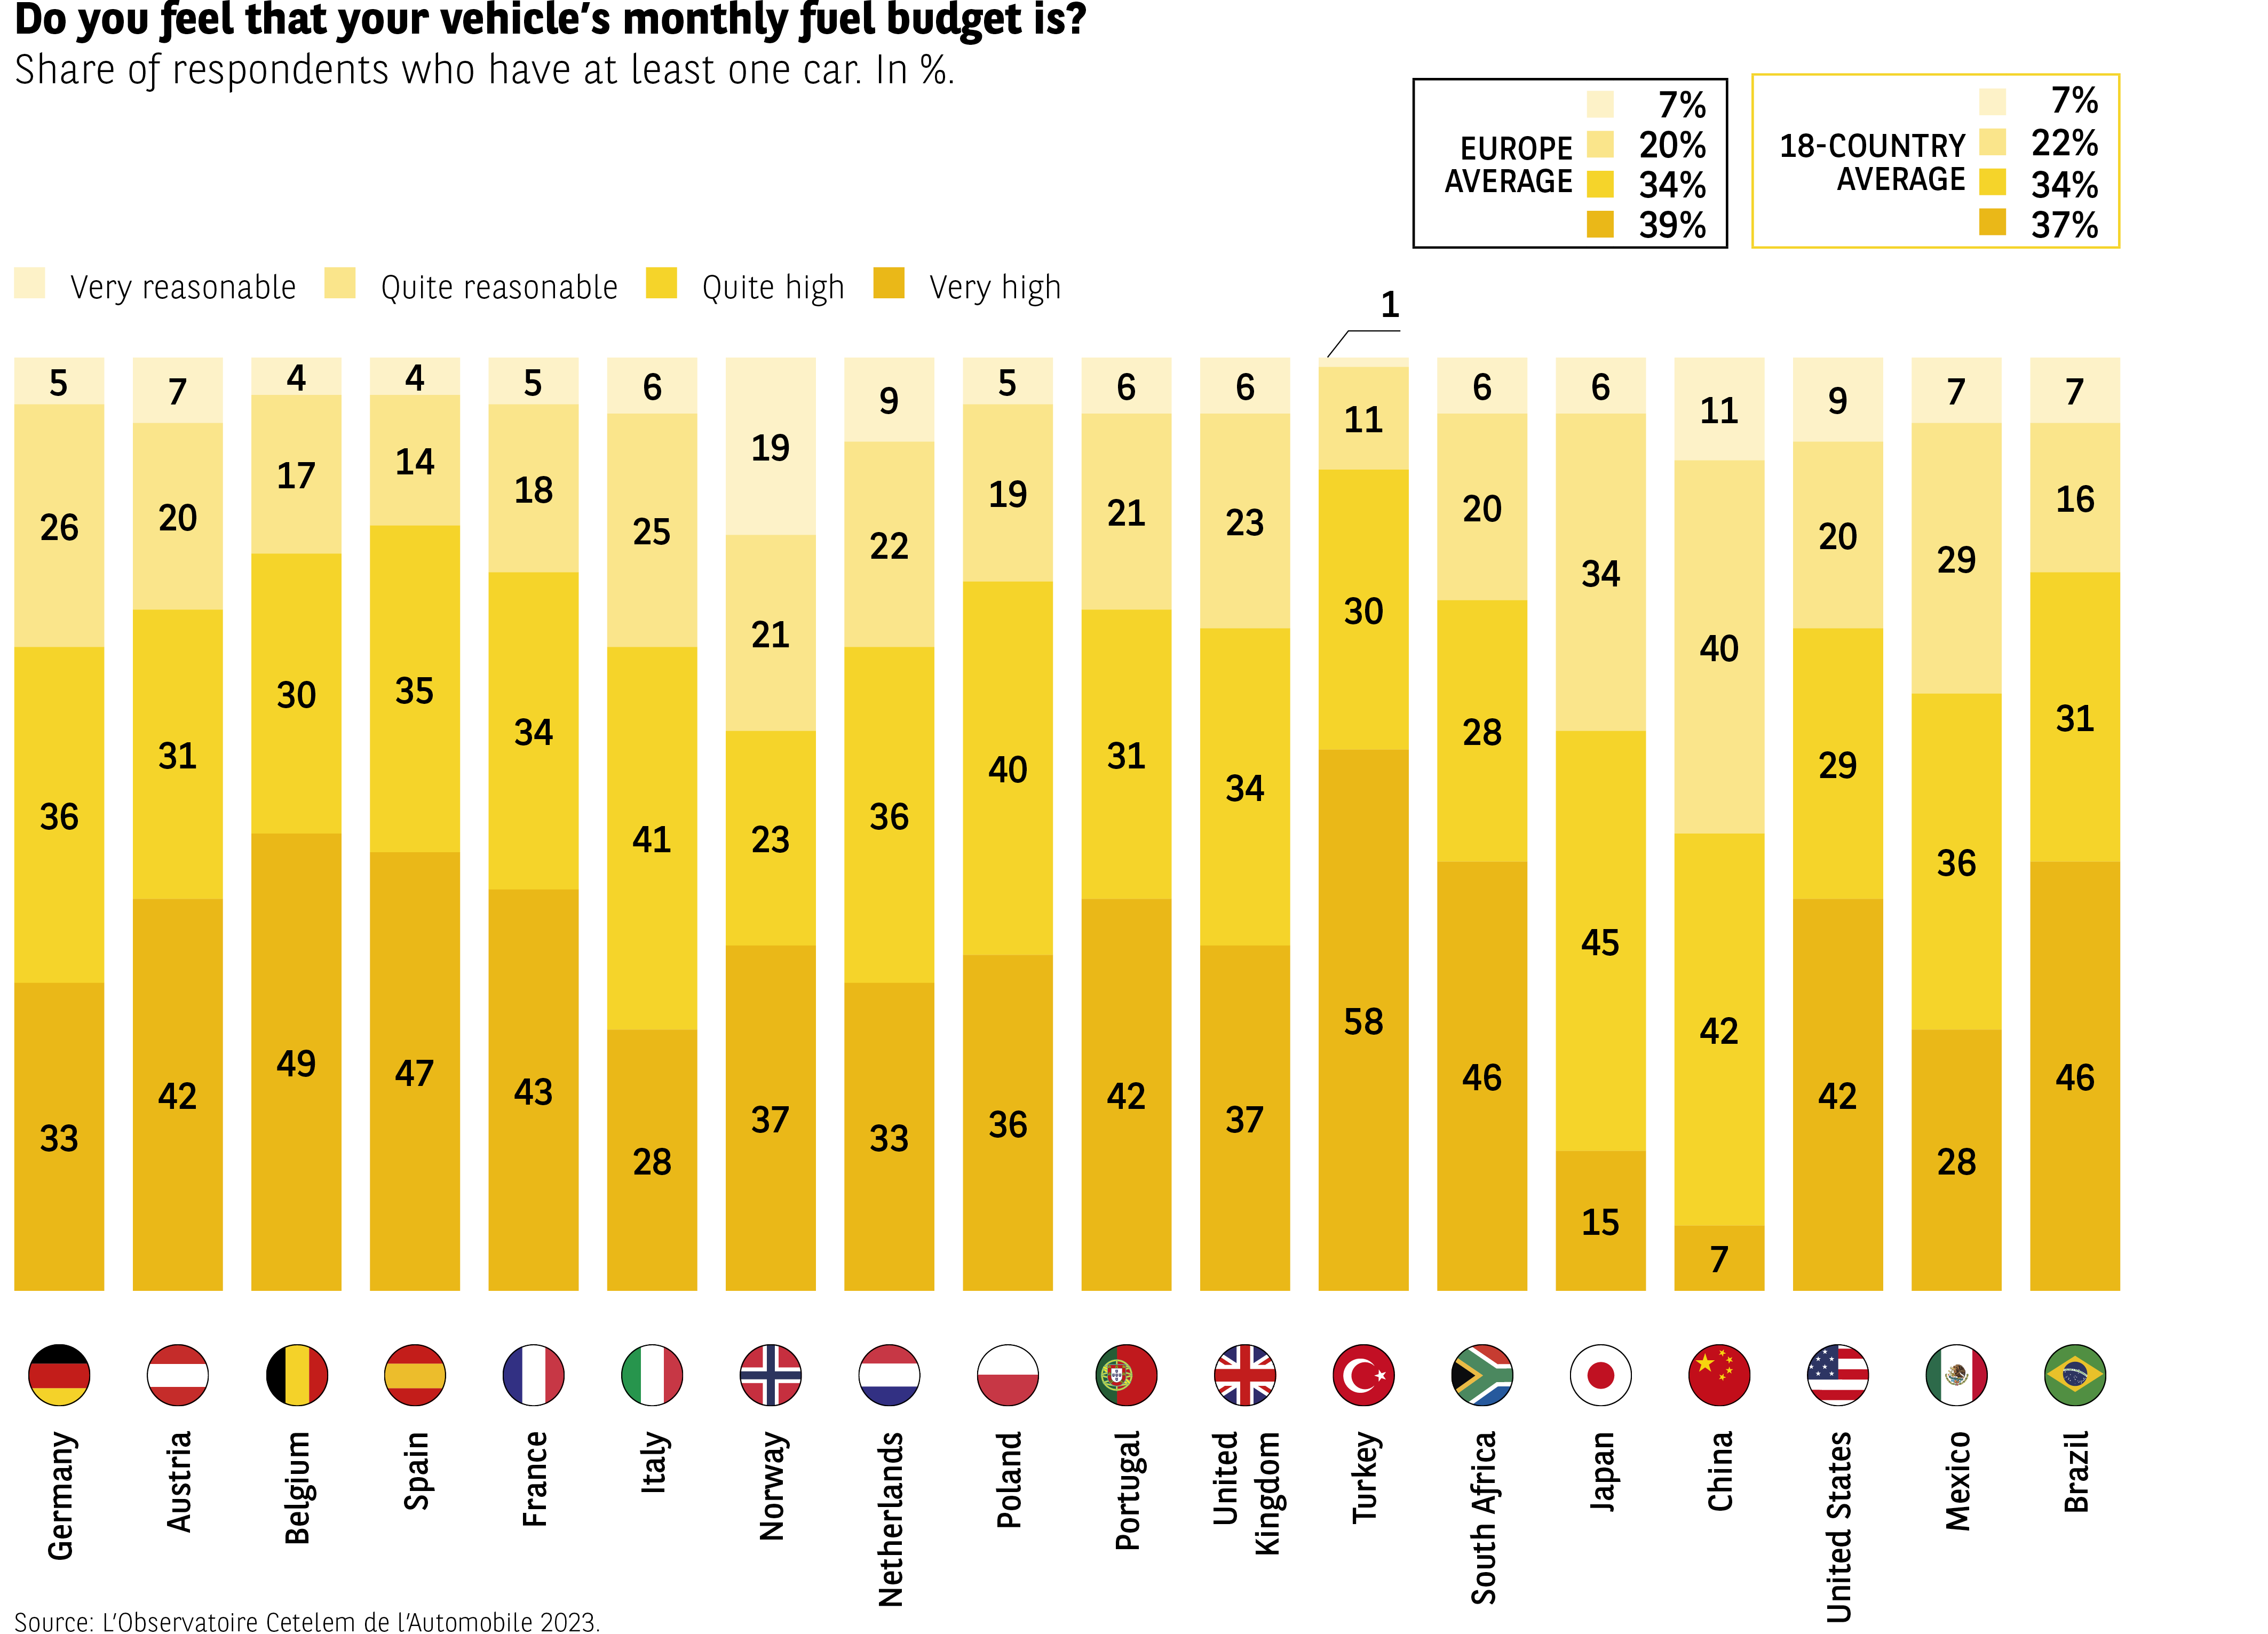 The infographic presents a series of stacked vertical bars for 18 countries.
Each bar visualizes the perception of the monthly fuel budget, in four categories:
– Very reasonable (VR)
– Rather reasonable (RR)
– Rather high (RH)
– Very high (VH)
In the top right corner, the European and 18-country averages indicate the average distribution of perceptions (in the order VR / RR / RH / VH):
– Europe: 7%, 20%, 34%, 39%
– 18 countries: 7%, 22%, 34%, 37%
Each country is represented with a flag and a segmented bar (in the order VR / RR / RH / VH):
United Kingdom: 11%, 30%, 28%, 31%
Turkey: 6%, 11%, 25%, 58%
South Africa: 6%, 8%, 31%, 46%
Japan: 5%, 15%, 34%, 45%
China: 6%, 11%, 40%, 42%
Brazil: 7%, 16%, 31%, 46%
Strong variation between countries in the perception of fuel costs.
Some countries (Turkey, South Africa, Brazil) have a very high proportion of people who consider the budget “very high”.
Others (United States, China, Japan) show lower levels of perception of a “very high” cost.
The European average is generally in the middle of the table, without any extreme values.
Source: Cetelem Automotive Observatory 2023
The infographic presents a series of stacked vertical bars for 18 countries.
Each bar visualizes the perception of the monthly fuel budget, in four categories:
– Very reasonable (VR)
– Rather reasonable (RR)
– Rather high (RH)
– Very high (VH)
In the top right corner, the European and 18-country averages indicate the average distribution of perceptions (in the order VR / RR / RH / VH):
– Europe: 7%, 20%, 34%, 39%
– 18 countries: 7%, 22%, 34%, 37%
Each country is represented with a flag and a segmented bar (in the order VR / RR / RH / VH):
United Kingdom: 11%, 30%, 28%, 31%
Turkey: 6%, 11%, 25%, 58%
South Africa: 6%, 8%, 31%, 46%
Japan: 5%, 15%, 34%, 45%
China: 6%, 11%, 40%, 42%
Brazil: 7%, 16%, 31%, 46%
Strong variation between countries in the perception of fuel costs.
Some countries (Turkey, South Africa, Brazil) have a very high proportion of people who consider the budget “very high”.
Others (United States, China, Japan) show lower levels of perception of a “very high” cost.
The European average is generally in the middle of the table, without any extreme values.
Source: Cetelem Automotive Observatory 2023
Spectacular price rises
A quick glance at diesel prices at the pump in several of the countries surveyed goes some way to explaining the feelings of motorists (Fig 24). In Japan, price rises have indeed remained relatively contained. Conversely, in the United States and Mexico prices have risen by more than 50%, causing consumers in those countries to forget how low they still are compared to other countries.
This increase has had a direct impact on the distances motorists drive. In France, an extra euro on the price of a litre of diesel prompts motorists to travel 1,000 fewer kilometres per year in the short term. Over the long term, such a price increase reduces the average annual distance travelled by 7,500 kilometres.
Fig 24 – Evolution of the price of a liter of gasoline in 2016 and 2022 by country
Download this infographic for your presentations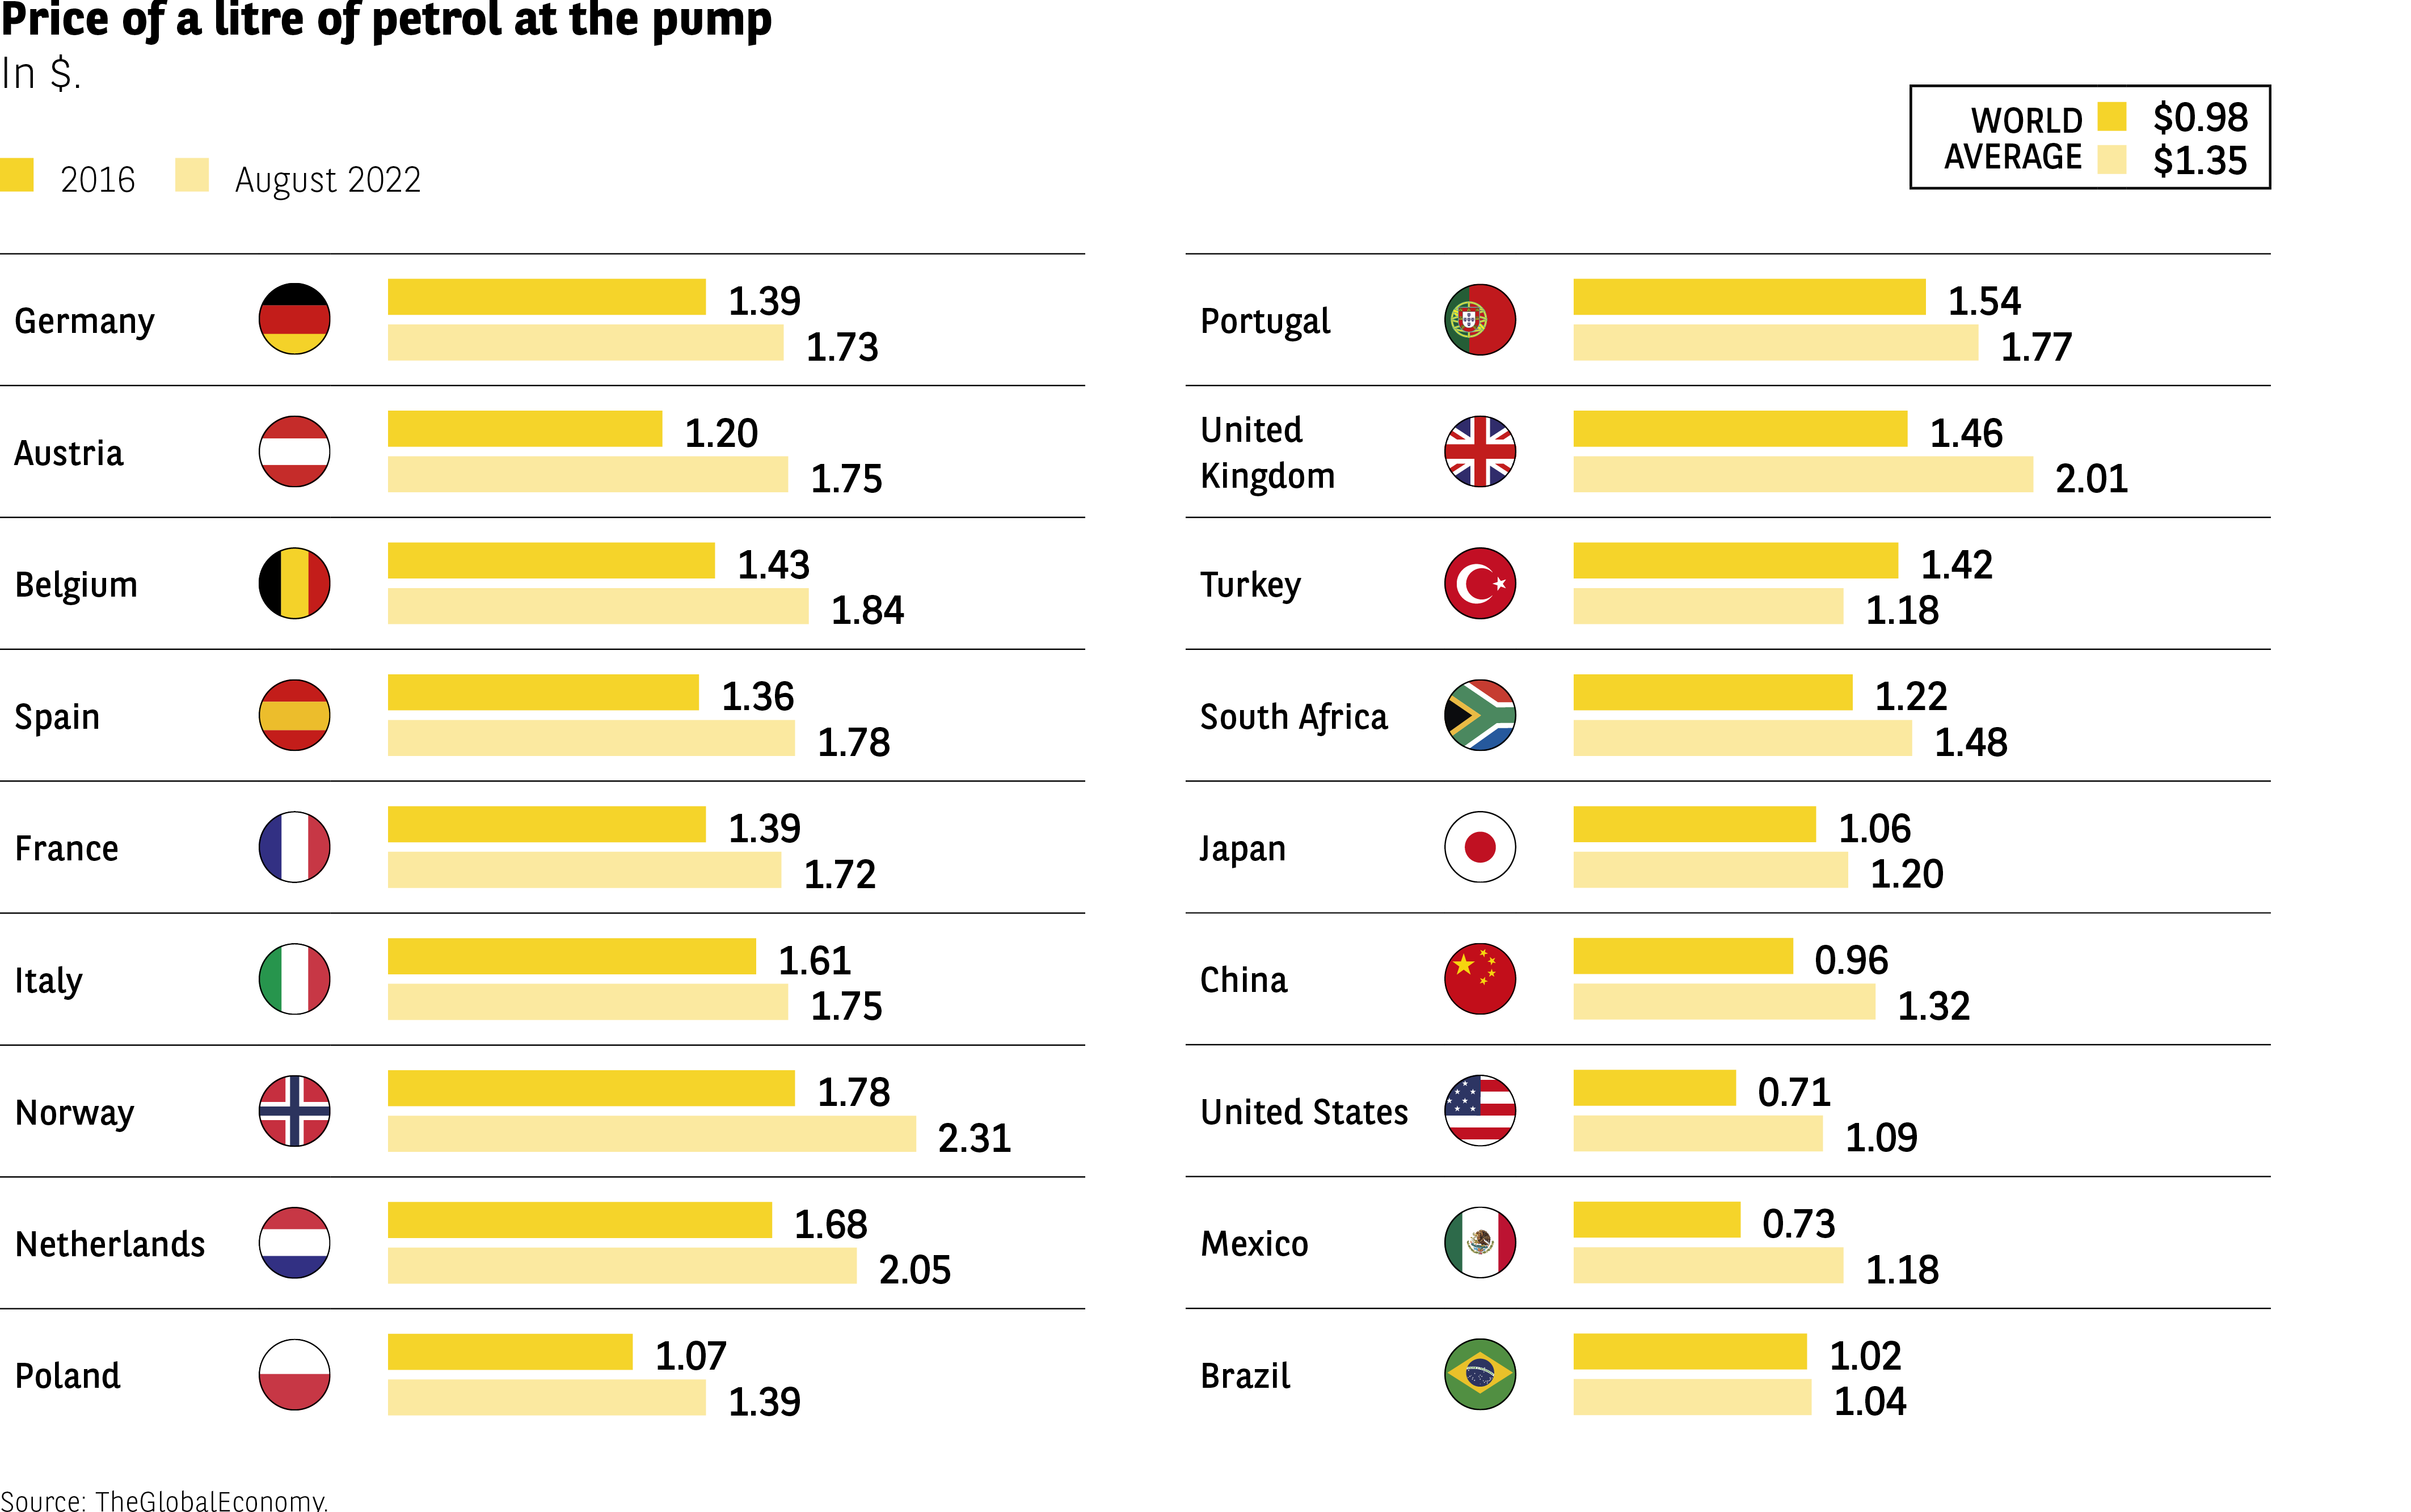 The infographic displays two values for each country: the price of a liter of gasoline at the pump in 2016 and in August 2022, expressed in dollars.
On the right, the global averages are indicated:
– 2016: $0.98
– 2022: $1.35
Examples of countries presented:
Germany: $1.39 → $1.73
Austria: $1.20 → $1.75
Belgium: $1.43 → $1.84
France: $1.39 → $1.72
Italy: $1.61 → $1.75
Norway: $1.78 → $2.31
Netherlands: $1.68 → $2.05
United States: $0.71 → $1.09
Mexico: $0.73 → $1.18
Brazil: $1.02 → $1.04
All countries show an increase in price between 2016 and 2022.
European countries consistently have prices higher than the global average.
Norway and the Netherlands have among the highest levels in 2022.
The United States and Mexico remain well below the global average despite the increase.
Brazil has a very small increase compared to other countries.
Source: TheGlobalEconomy
The infographic displays two values for each country: the price of a liter of gasoline at the pump in 2016 and in August 2022, expressed in dollars.
On the right, the global averages are indicated:
– 2016: $0.98
– 2022: $1.35
Examples of countries presented:
Germany: $1.39 → $1.73
Austria: $1.20 → $1.75
Belgium: $1.43 → $1.84
France: $1.39 → $1.72
Italy: $1.61 → $1.75
Norway: $1.78 → $2.31
Netherlands: $1.68 → $2.05
United States: $0.71 → $1.09
Mexico: $0.73 → $1.18
Brazil: $1.02 → $1.04
All countries show an increase in price between 2016 and 2022.
European countries consistently have prices higher than the global average.
Norway and the Netherlands have among the highest levels in 2022.
The United States and Mexico remain well below the global average despite the increase.
Brazil has a very small increase compared to other countries.
Source: TheGlobalEconomy
The impact of prices at the pump varies
In concrete terms, the average monthly fuel budget of motorists in the 18 countries covered by L’Observatoire Cetelem de l’Automobile 2023 is €133. Although prices have skyrocketed everywhere, there are significant differences between the countries, and not always where one would expect them (Fig 25).
Motorists in Japan are relatively unmoved by the impact of high fuel prices and it is they who report the lowest estimated monthly expenditure: €92. In all other countries the figure exceeds €100, in some cases by a significant margin. In Belgium and the United States, the leading pair in this particular ranking, spending on fuel totals €165 a month. In most EU countries, Portugal and Poland aside, monthly fuel budgets are fairly similar.
Fig 25 – Monthly fuel cost by country
Download this infographic for your presentations The infographic presents the average monthly fuel expenses for drivers in 18 countries. The values are expressed in euros.
Two benchmarks are indicated at the top:
– European average: €141
– 18-country average: €133
Visible data (in €):
Germany: €153
Austria: €151
Belgium: €165
Spain: €145
France: €145
Italy: €135
Norway: €158
Netherlands: €141
Poland: €112
Portugal: €121
United Kingdom: €124
Turkey: €121
South Africa: €132
Japan: €92
China: €114
United States: €165
Mexico: €105
Brazil: €103
The values vary significantly from one country to another.
The highest amounts reach €165 (Belgium, United States).
The lowest levels are below €110 (Mexico, Brazil, Japan).
European countries are mostly above the 18-country average.
Source: Cetelem Automotive Observatory 2023
The infographic presents the average monthly fuel expenses for drivers in 18 countries. The values are expressed in euros.
Two benchmarks are indicated at the top:
– European average: €141
– 18-country average: €133
Visible data (in €):
Germany: €153
Austria: €151
Belgium: €165
Spain: €145
France: €145
Italy: €135
Norway: €158
Netherlands: €141
Poland: €112
Portugal: €121
United Kingdom: €124
Turkey: €121
South Africa: €132
Japan: €92
China: €114
United States: €165
Mexico: €105
Brazil: €103
The values vary significantly from one country to another.
The highest amounts reach €165 (Belgium, United States).
The lowest levels are below €110 (Mexico, Brazil, Japan).
European countries are mostly above the 18-country average.
Source: Cetelem Automotive Observatory 2023
Pressure on crude oil prices
On 24 February 2022, the day on which Vladimir Putin announced the launch of a “special operation” in Ukraine, the price of a barrel of crude oil exceeded $100 for the first time in 7 years. After several years of prices staying below $80, we appear to be entering a highly uncertain period. Today’s geopolitical and economic cocktail could hold many more surprises (Fig 26).
Fig 26 – Evolution of the price of a barrel of Brent crude oil
Download this infographic for your presentations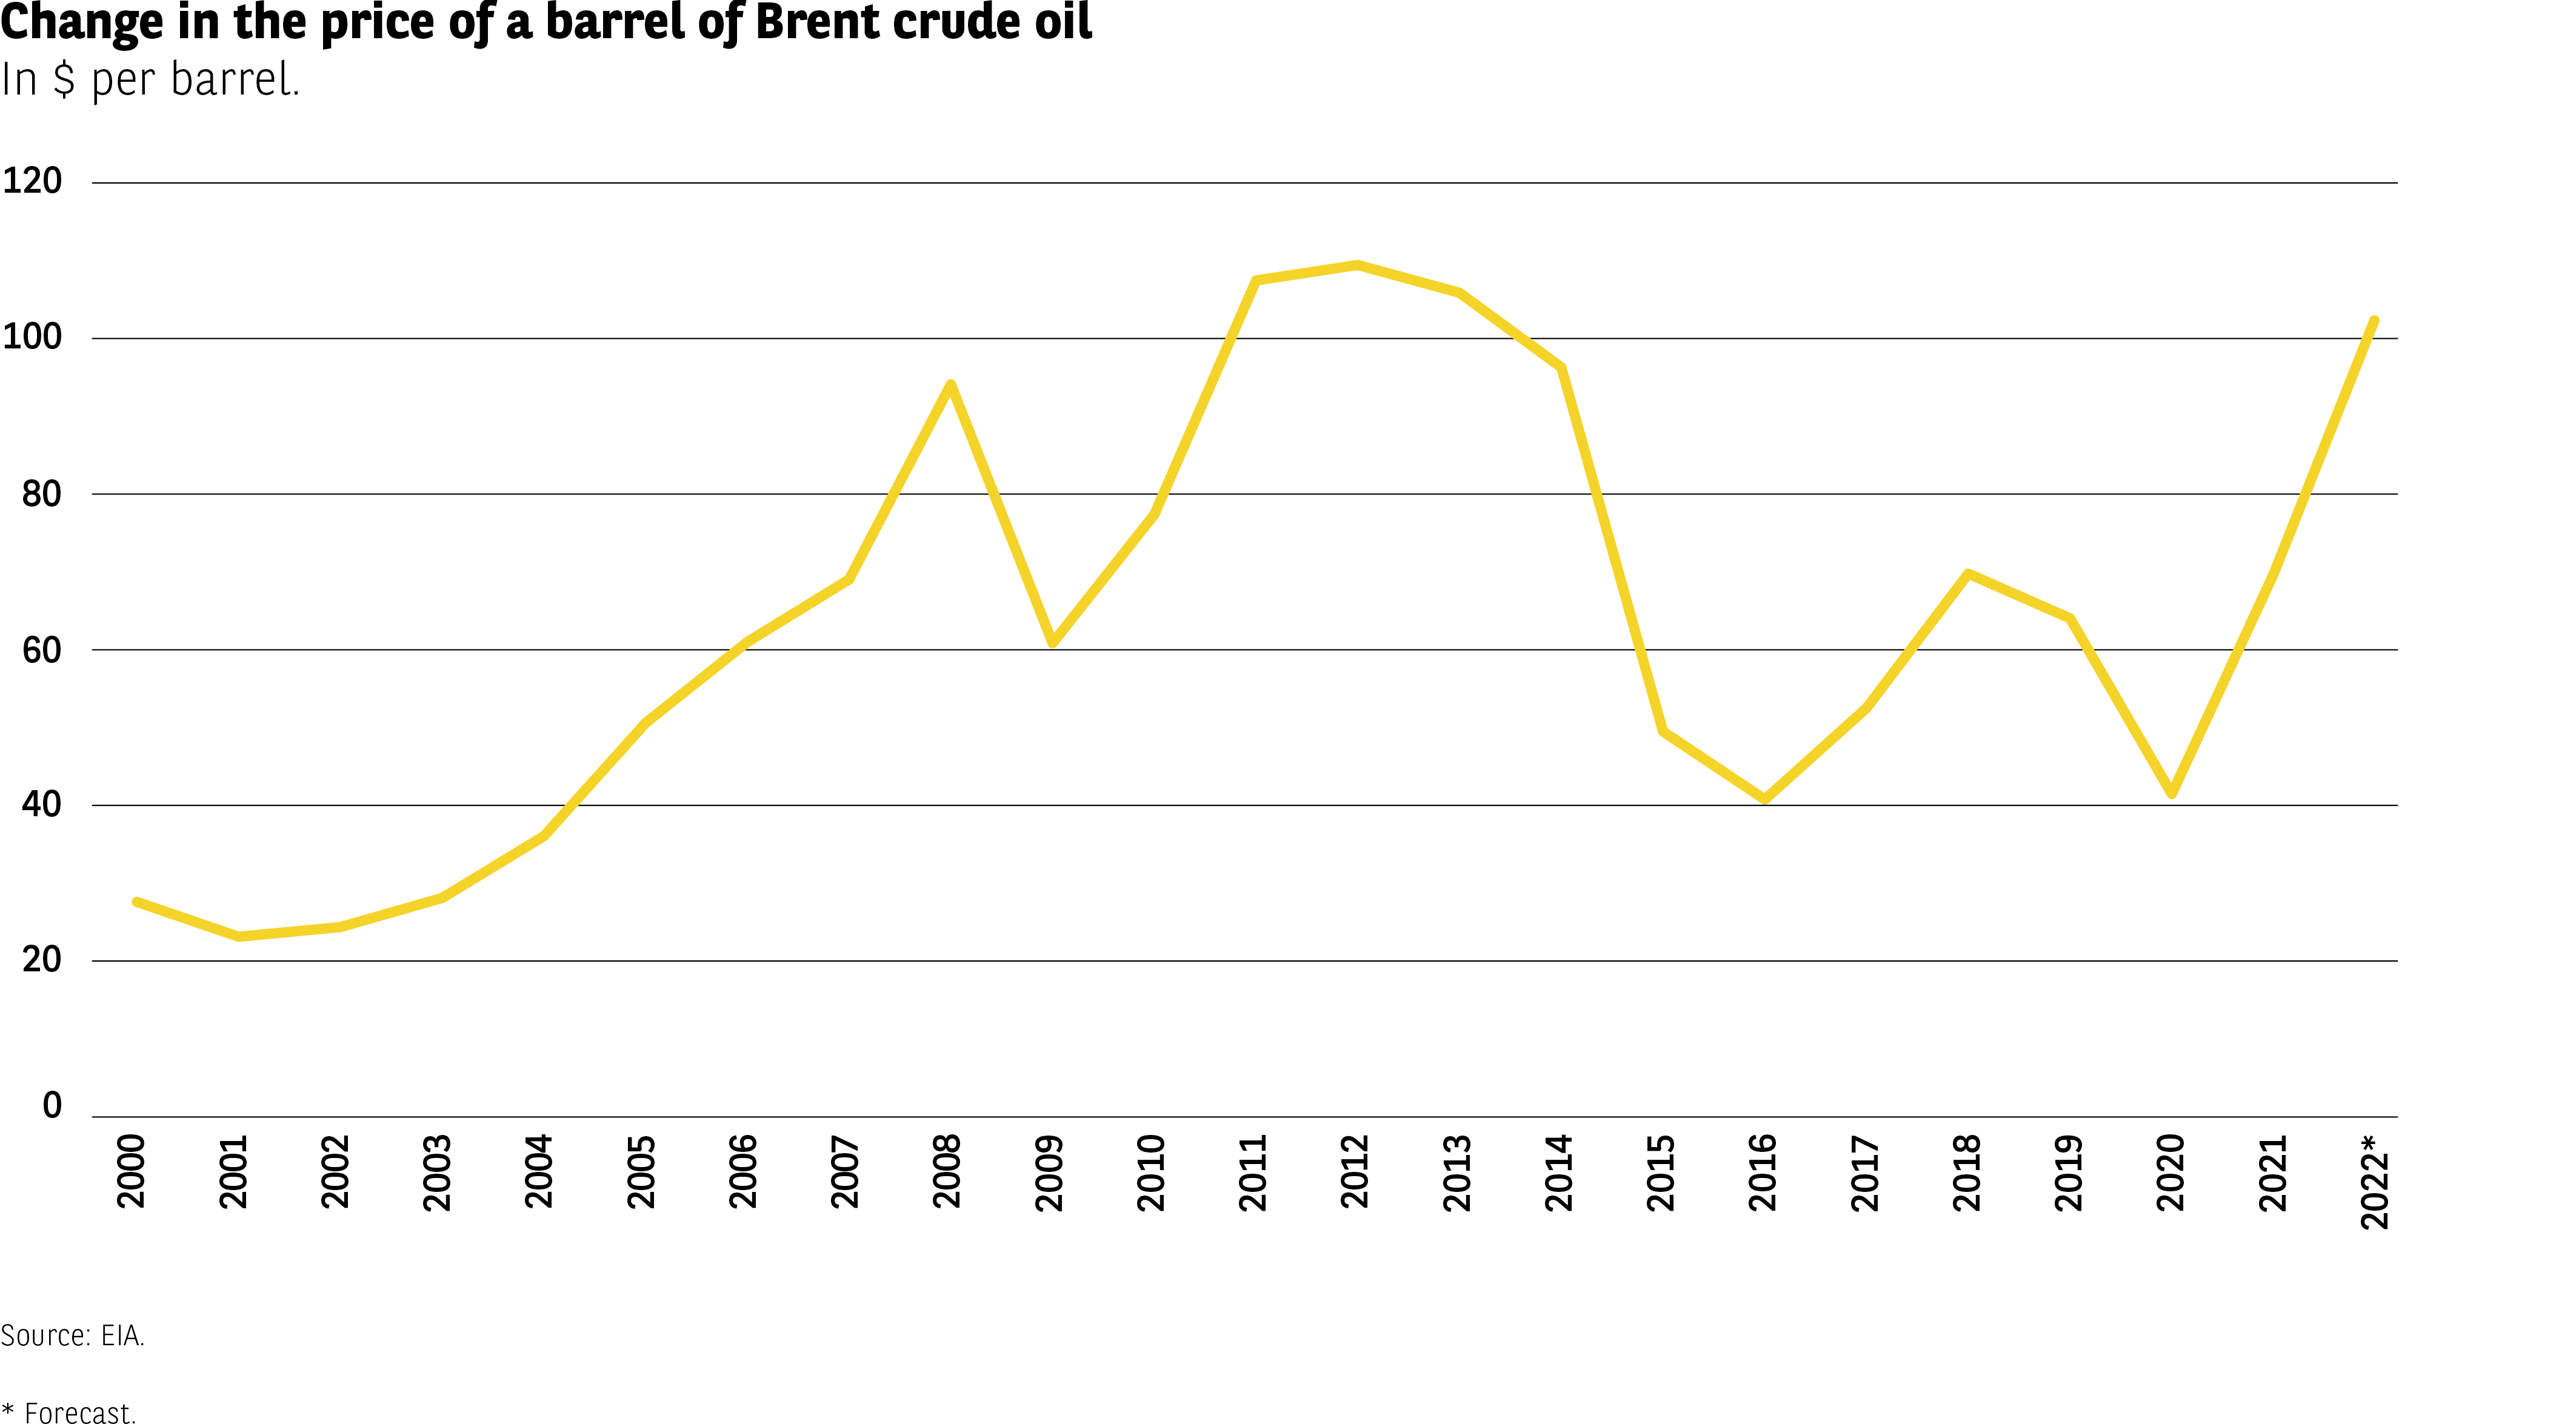 The infographic represents the evolution of the Brent crude oil price between 2000 and 2022, in dollars per barrel.
The vertical axis ranges from 0 to 120 dollars, and the horizontal axis indicates the years from 2000 to 2022. The 2022 value is noted as a forecast (*).
Approximate visible data from the curve:
Between 2000 and 2002: values around $20-30.
2003-2008: continuous increase to a peak near $100.
2009: marked decline to around $60.
2010-2012: new rise, exceeding $100.
2013-2014: plateau and beginning of decline.
2015-2016: sharp decline, around $40.
2017-2019: recovery around $60-70.
2020: new low (≈$40).
2021-2022: rapid increase, exceeding $100 in 2022 (forecast).
Alternation of marked phases of increase and decrease.
Three main peaks: 2008, 2012-2013, 2022*.
Two sharp declines: 2009 and 2014-2016.
Strong recovery in 2021-2022.
Source: EIA (Energy Information Administration)
Note: *Forecast for 2022″
The infographic represents the evolution of the Brent crude oil price between 2000 and 2022, in dollars per barrel.
The vertical axis ranges from 0 to 120 dollars, and the horizontal axis indicates the years from 2000 to 2022. The 2022 value is noted as a forecast (*).
Approximate visible data from the curve:
Between 2000 and 2002: values around $20-30.
2003-2008: continuous increase to a peak near $100.
2009: marked decline to around $60.
2010-2012: new rise, exceeding $100.
2013-2014: plateau and beginning of decline.
2015-2016: sharp decline, around $40.
2017-2019: recovery around $60-70.
2020: new low (≈$40).
2021-2022: rapid increase, exceeding $100 in 2022 (forecast).
Alternation of marked phases of increase and decrease.
Three main peaks: 2008, 2012-2013, 2022*.
Two sharp declines: 2009 and 2014-2016.
Strong recovery in 2021-2022.
Source: EIA (Energy Information Administration)
Note: *Forecast for 2022″