It’s hard to live a carless life


Going back in history, especially pre-history, mankind was nomadic.
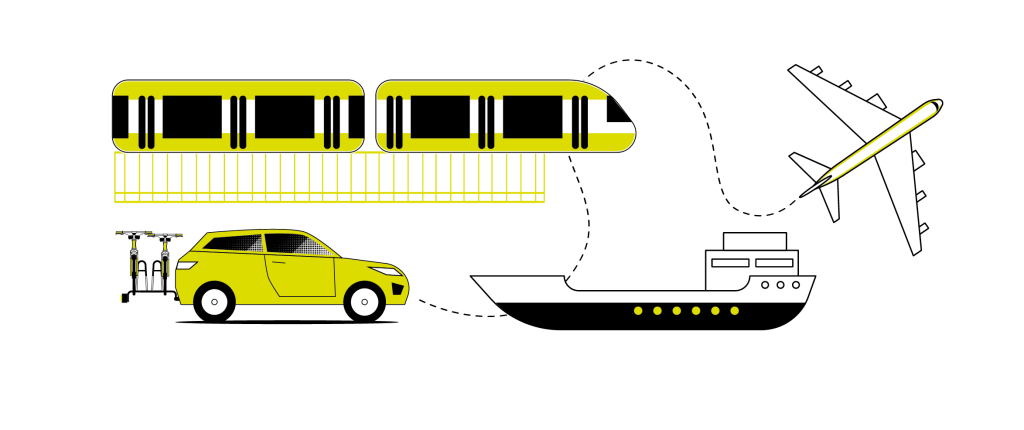
Mobility was essential to both the survival and security of humans. Since the early 20th century, this mobility has been embodied by the automobile. Every day and during the weekends and holidays, cars are a central part of people’s journeys.
However, under the direct influence of structural economic, environmental and societal changes, of which climate change is one of the most striking examples, behaviours and practices are evolving. The automobile’s influence is being eroded.
The development of public transport and the emergence of soft mobility, particularly in towns and cities, are increasingly providing natural and complementary alternatives to cars, which are seeing their central role in society diminish.
At the heart of people’s journeys…
Unbridled practicality
In every imaginable day-to-day situation, cars unquestionably remain the ideal mode of transport. This is especially true when shopping or enjoying sporting activities (Fig 34). 9 out of 10 respondents say they use their vehicle often or very often in these cases. When they go away for the weekend or on holiday, 8 out of 10 choose to go by car.
This proportion drops slightly when it comes to daily journeys, including commuting. In these situations, three-quarters of people use their car.
It is worth noting that this score is down by 5 points compared to last year, presumably due to the impact of the global health crisis, which led to fewer people travelling to their workplace.
With such high scores, it makes sense that the differences between countries are smaller. The Austrians, the French and the British are slightly less likely than average to use their cars on a daily basis (63%, 64% and 64%), unlike the Chinese, the Mexicans and the South Africans (90%).
Fig 34 – Vehicle usage by type of trip
Download this infographic for your presentations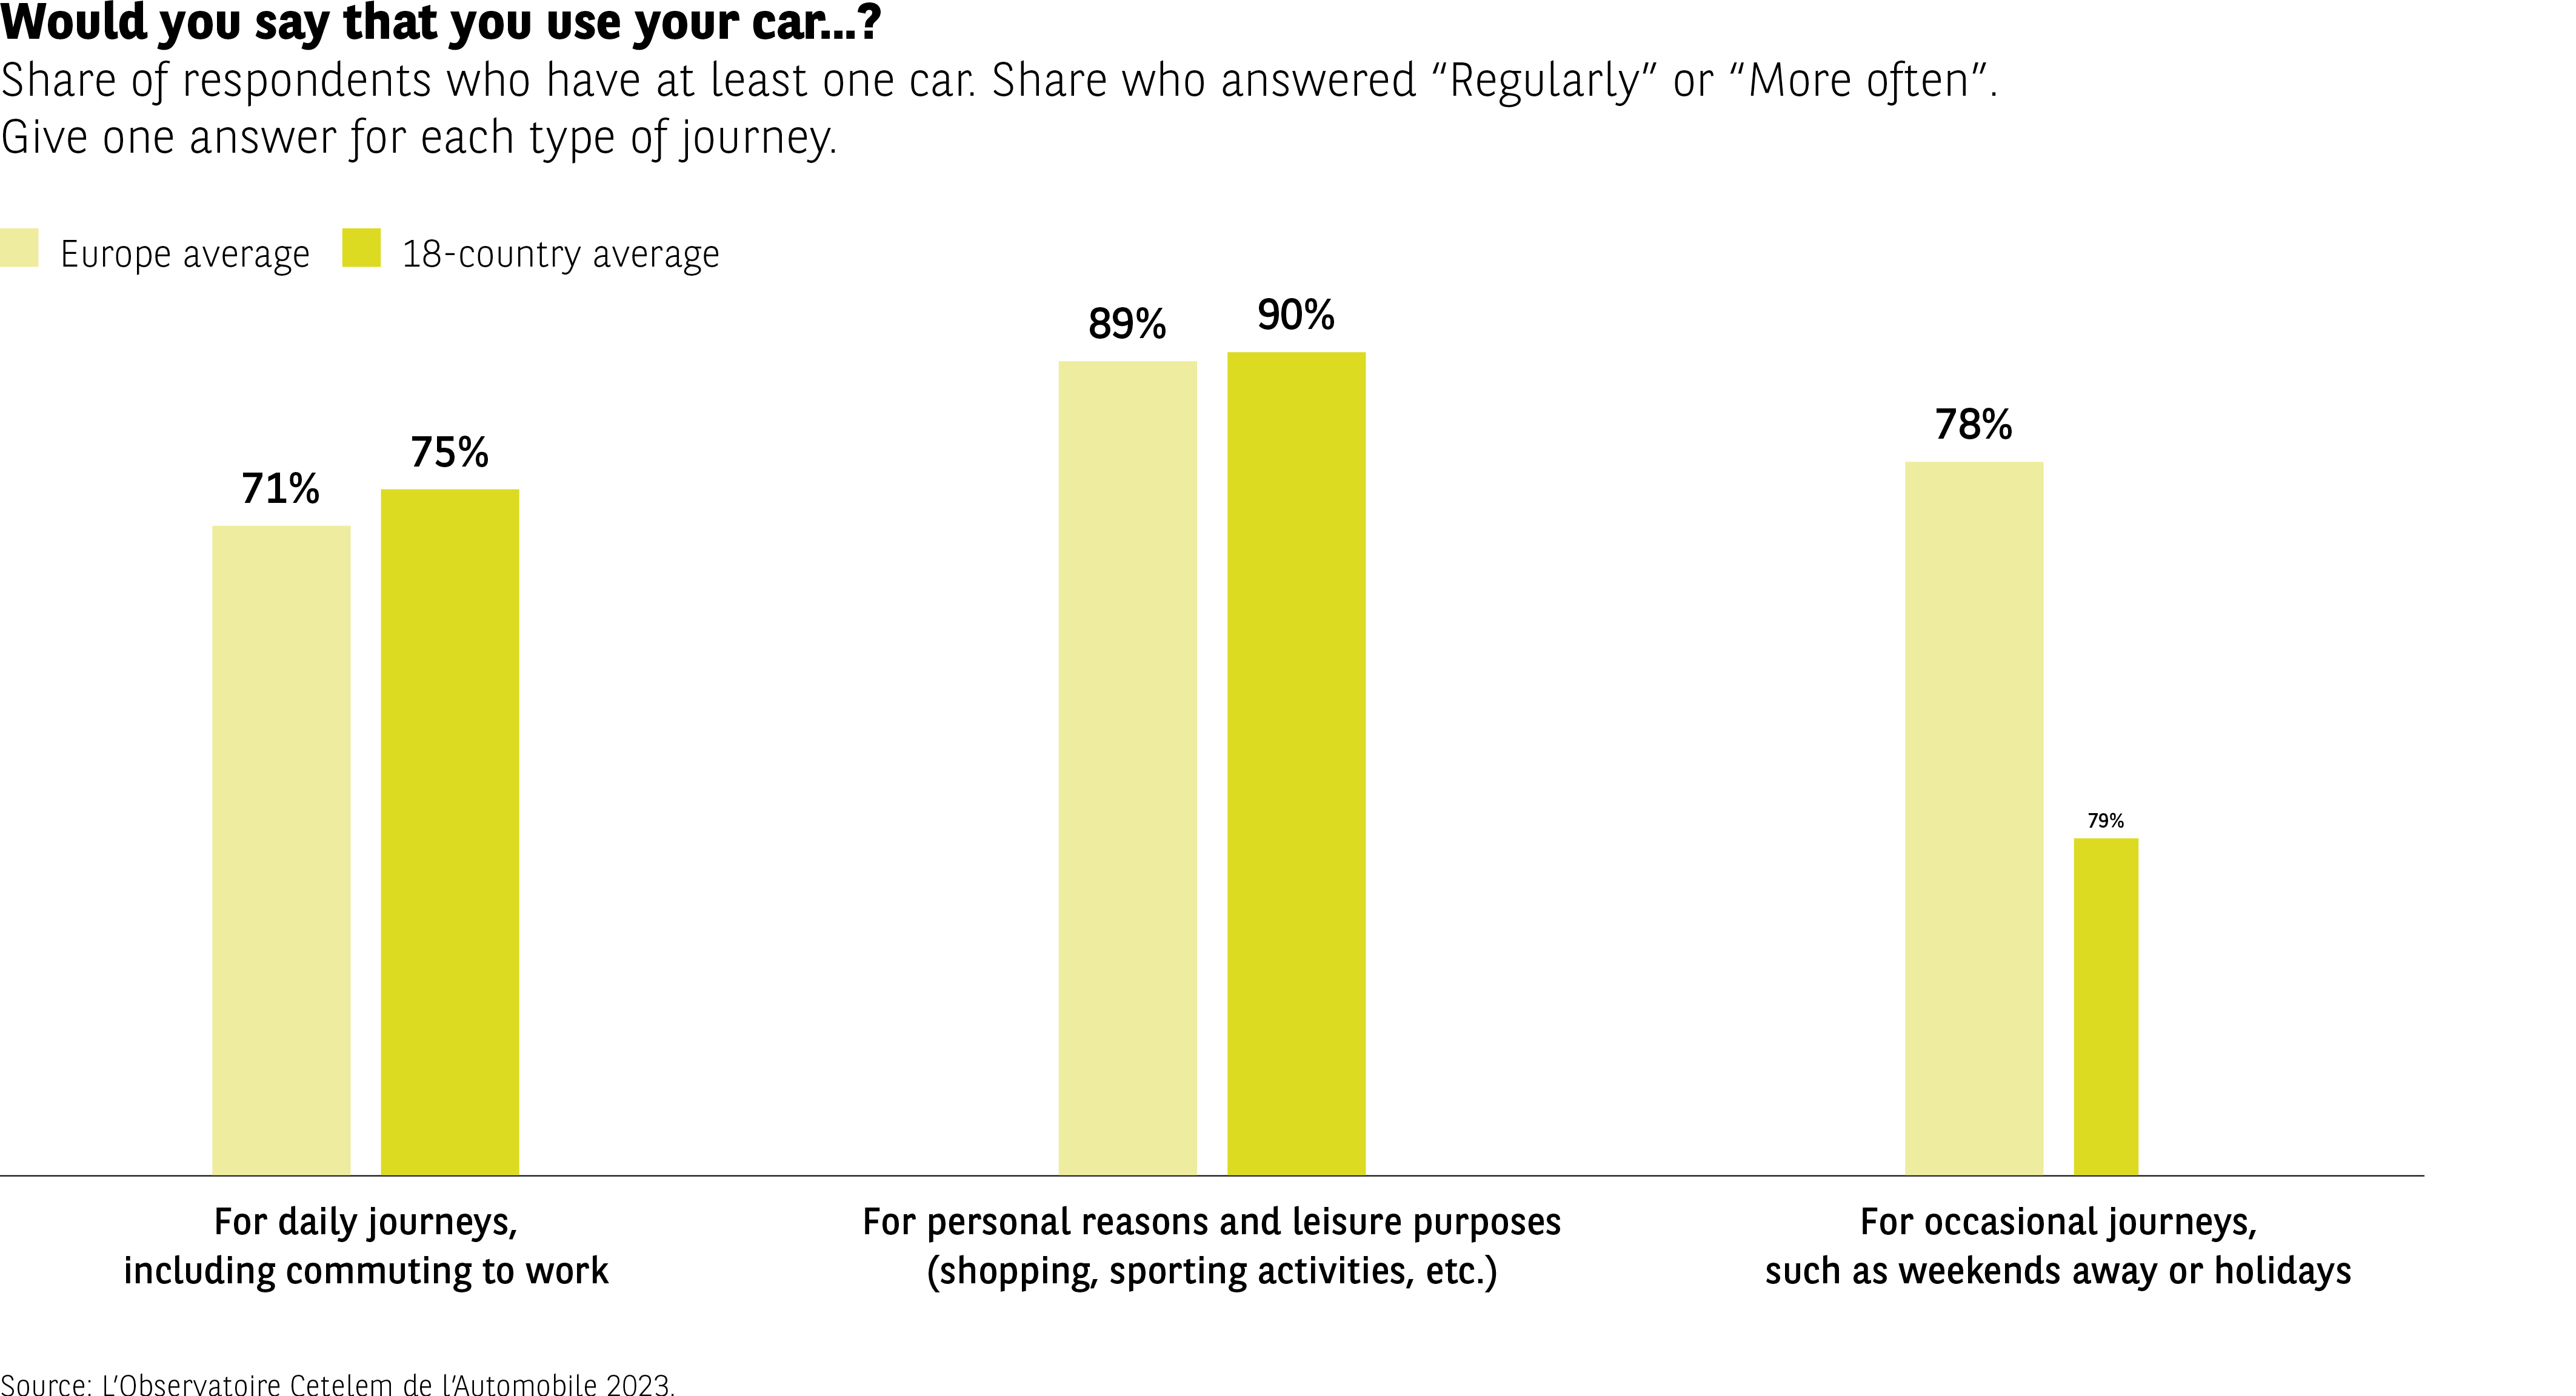 Infographic presenting the percentage of drivers using their car “regularly” or “more often” for three types of trips: daily commutes, private/travel, and occasional trips.
Comparative data between European average and average of 18 countries (in %):
– Daily commutes: 71% → 75%
– Private and leisure trips (shopping, sports, etc.): 89% → 90%
– Occasional trips (weekends, vacations, etc.): 78% → 79%
The most frequent use concerns private and leisure trips, very high in both groups. The use for daily commutes and occasional trips remains important, with a slight increase in the 18 countries compared to the European average.
Source: The Cetelem Automotive Observatory 2023.
Infographic presenting the percentage of drivers using their car “regularly” or “more often” for three types of trips: daily commutes, private/travel, and occasional trips.
Comparative data between European average and average of 18 countries (in %):
– Daily commutes: 71% → 75%
– Private and leisure trips (shopping, sports, etc.): 89% → 90%
– Occasional trips (weekends, vacations, etc.): 78% → 79%
The most frequent use concerns private and leisure trips, very high in both groups. The use for daily commutes and occasional trips remains important, with a slight increase in the 18 countries compared to the European average.
Source: The Cetelem Automotive Observatory 2023.
More at home on rural roads than on city streets
The types of roads motorists use reveals a clearer geographical divide. Indeed, the Europeans tend to use their cars equally in urban and rural environments, while the rest of the world use their vehicles mainly in towns and cities. If we consider the world as a whole, 1 in 2 people say they use their vehicle in both urban and rural settings. The countries where car use is more varied tend to be the smaller nations in terms of size, as illustrated by the fact that 68% of Dutch and 60% of Belgian drivers use their vehicle in both rural and urban environments (Fig 35). The countries where people drive their cars primarily, not to say exclusively, in urban areas tend to be those containing vast expanses of land and numerous megacities, such as Brazil and China (88% and 80%).
Fig 35 – Types of environments where the vehicle is used
Download this infographic for your presentations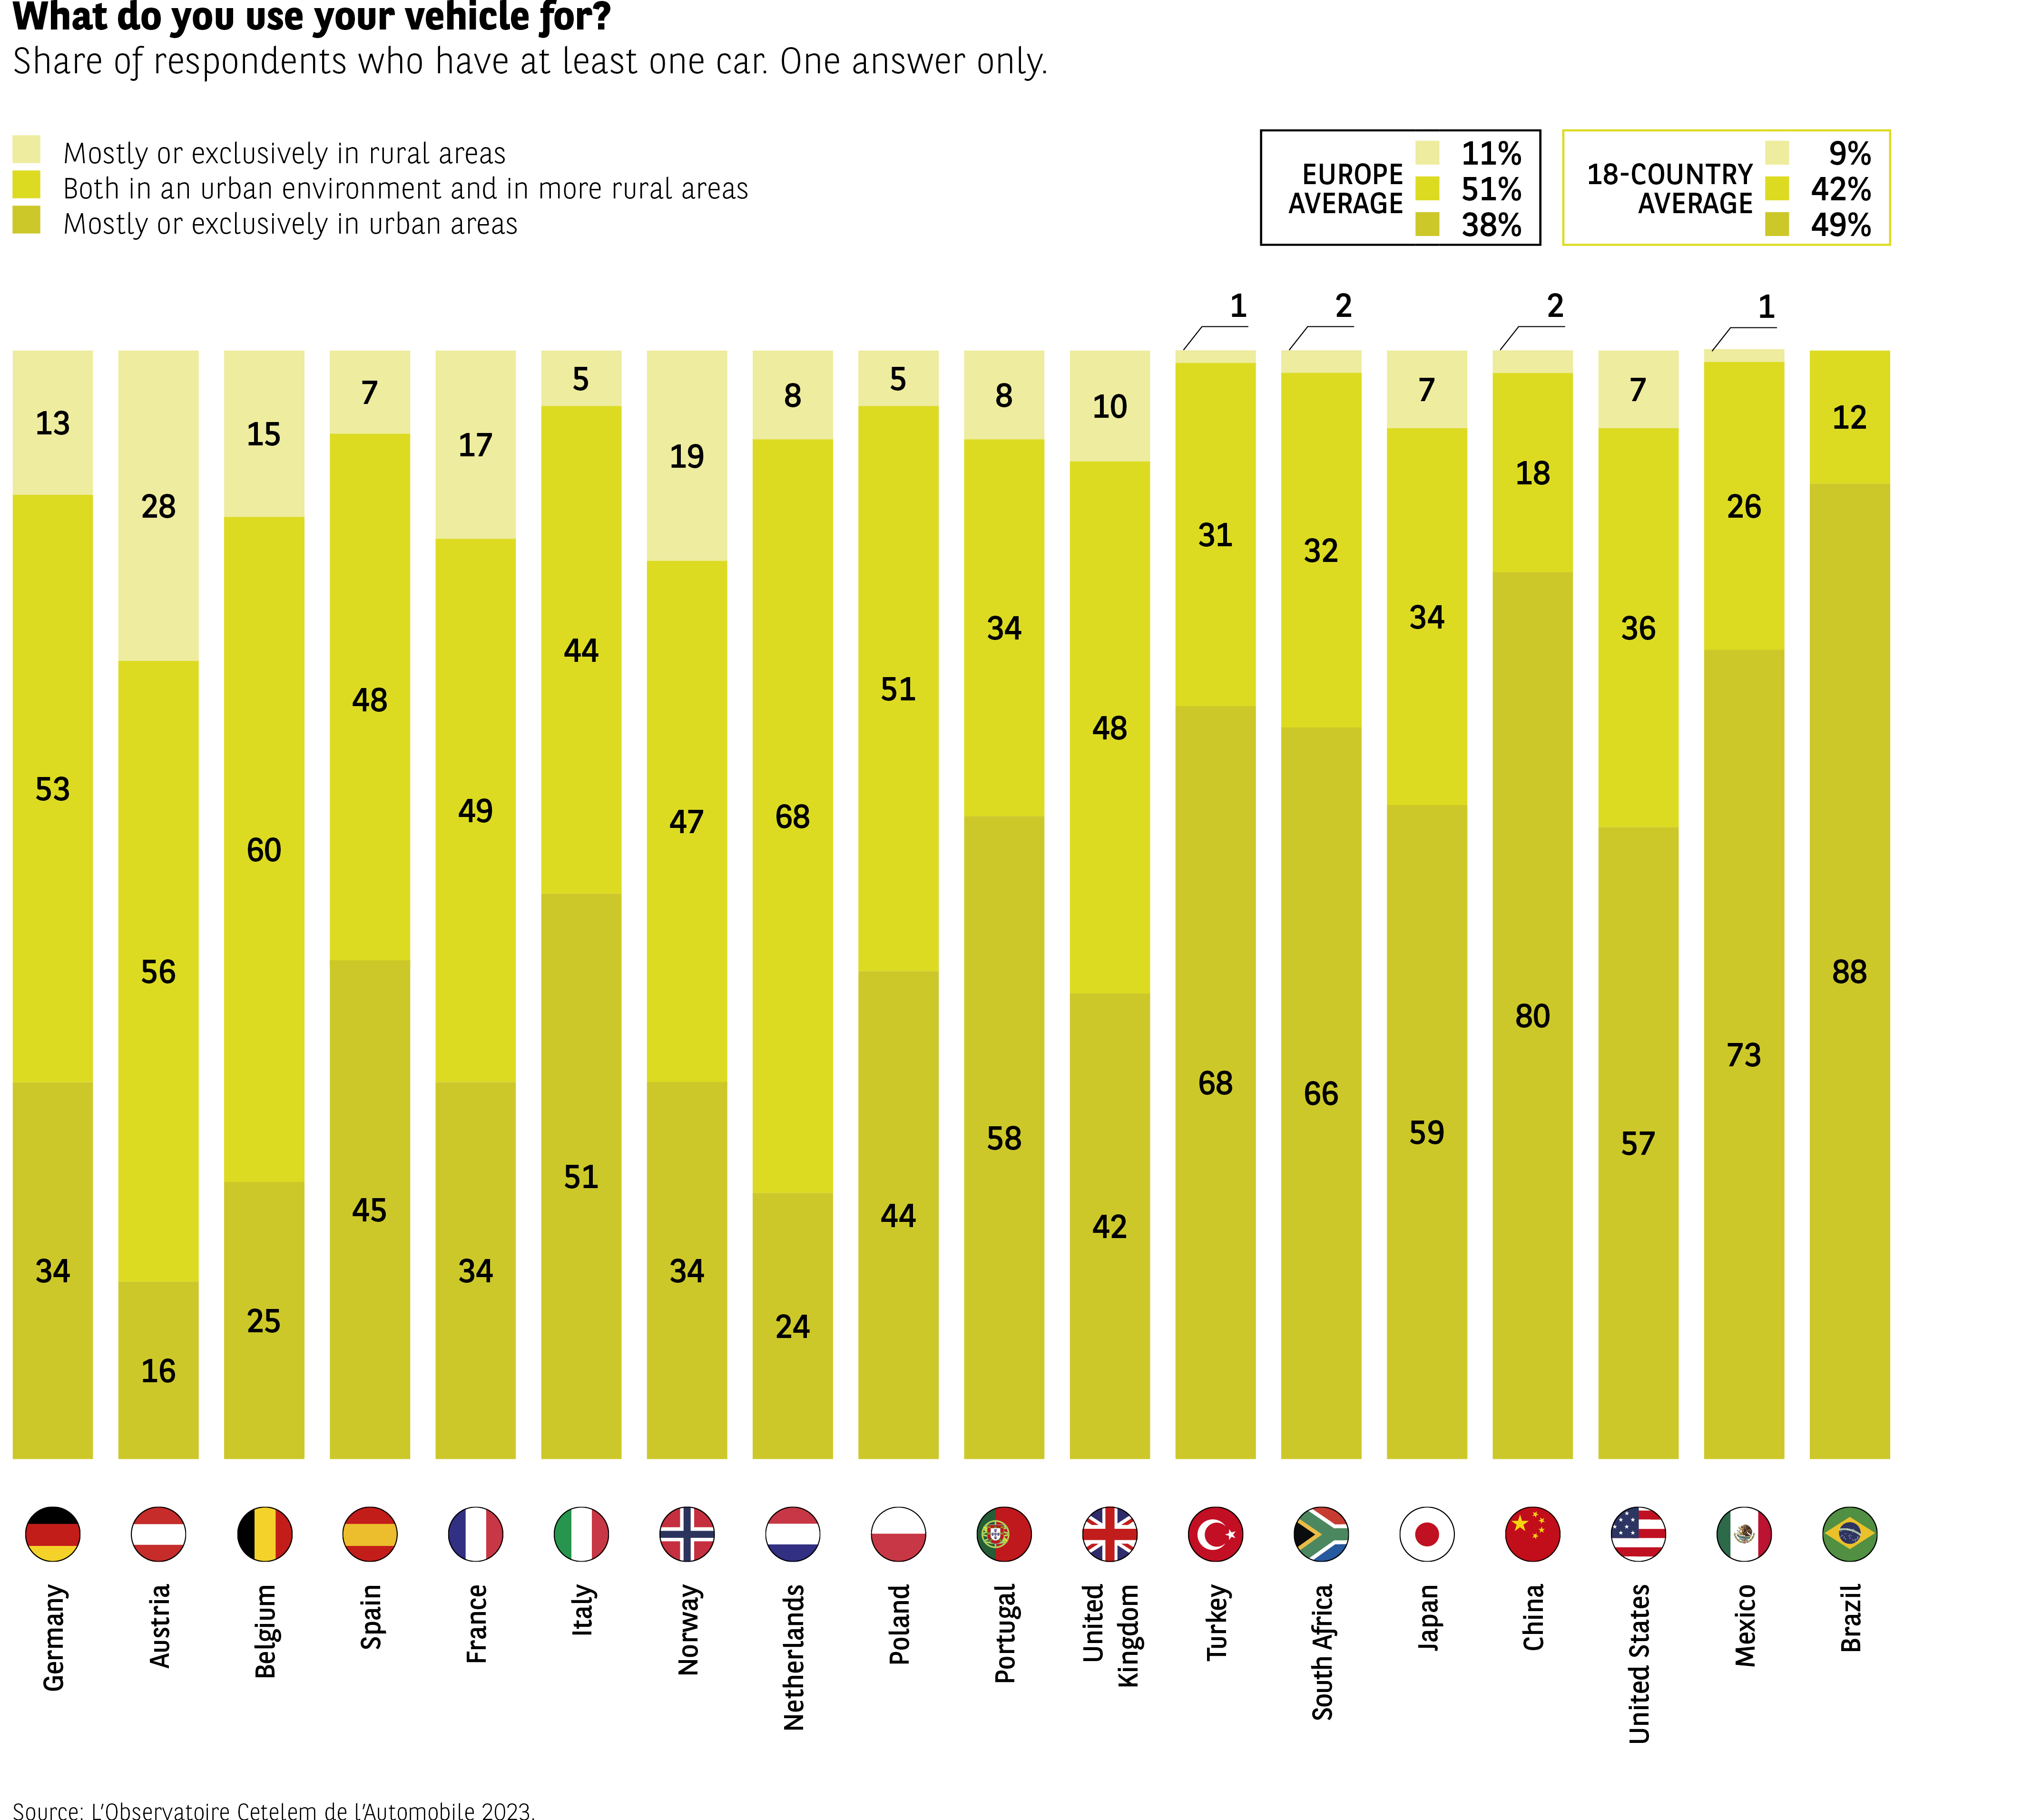 Infographic presenting the distribution of vehicle use according to three environments:
– mainly or exclusively in rural areas,
– in both urban and rural areas,
– mainly or exclusively in urban areas.
Averages:
– Europe: rural 11%, mixed 51%, urban 38%
– 18 countries: rural 9%, mixed 42%, urban 49%
Data by country and in order: Rural / Mixed / Urban (in %):
Germany: 13 / 56 / 34
Austria: 15 / 60 / 25
Belgium: 7 / 48 / 45
Spain: 17 / 49 / 34
France: 19 / 34 / 45
Italy: 8 / 51 / 34
Norway: 5 / 47 / 44
Netherlands: 5 / 68 / 24
Poland: 10 / 48 / 42
Portugal: 3 / 58 / 31
United Kingdom: 1 / 32 / 66
Turkey: 2 / 34 / 59
South Africa: 2 / 34 / 57
Japan: 7 / 18 / 80
China: 7 / 36 / 57
United States: 1 / 26 / 73
Mexico: 12 / 0 / 88
Brazil: 1 / 12 / 0
Mixed use is dominant in most European countries. Countries like Japan, the United States, and Mexico show a very high urban use. Rural use remains marginal in most countries, but more visible in Germany, Austria, or France.
Source: The Cetelem Automotive Observatory 2023.
Infographic presenting the distribution of vehicle use according to three environments:
– mainly or exclusively in rural areas,
– in both urban and rural areas,
– mainly or exclusively in urban areas.
Averages:
– Europe: rural 11%, mixed 51%, urban 38%
– 18 countries: rural 9%, mixed 42%, urban 49%
Data by country and in order: Rural / Mixed / Urban (in %):
Germany: 13 / 56 / 34
Austria: 15 / 60 / 25
Belgium: 7 / 48 / 45
Spain: 17 / 49 / 34
France: 19 / 34 / 45
Italy: 8 / 51 / 34
Norway: 5 / 47 / 44
Netherlands: 5 / 68 / 24
Poland: 10 / 48 / 42
Portugal: 3 / 58 / 31
United Kingdom: 1 / 32 / 66
Turkey: 2 / 34 / 59
South Africa: 2 / 34 / 57
Japan: 7 / 18 / 80
China: 7 / 36 / 57
United States: 1 / 26 / 73
Mexico: 12 / 0 / 88
Brazil: 1 / 12 / 0
Mixed use is dominant in most European countries. Countries like Japan, the United States, and Mexico show a very high urban use. Rural use remains marginal in most countries, but more visible in Germany, Austria, or France.
Source: The Cetelem Automotive Observatory 2023.
The bigger the country, the more people drive
One measure of automobility is the distance travelled. According to the data collected, motorists drive an average of 13,600 km a year in the countries surveyed (Fig 36). And once again, there is a correlation between the size of the country and the number of kilometres driven. The top four nations in this particular ranking are Brazil, Turkey, China and Mexico, the 5th, 37th, 4th and 14th largest countries in the world, respectively. Italy sits in 5th place, pulling off the “feat” of surpassing the United States, the world’s 3rd largest country in terms of surface area. It is interesting to note that France lies at the bottom of this ranking, with an average of 12,400 km travelled per year.
Fig 36 – Estimated annual mileage by country
Download this infographic for your presentations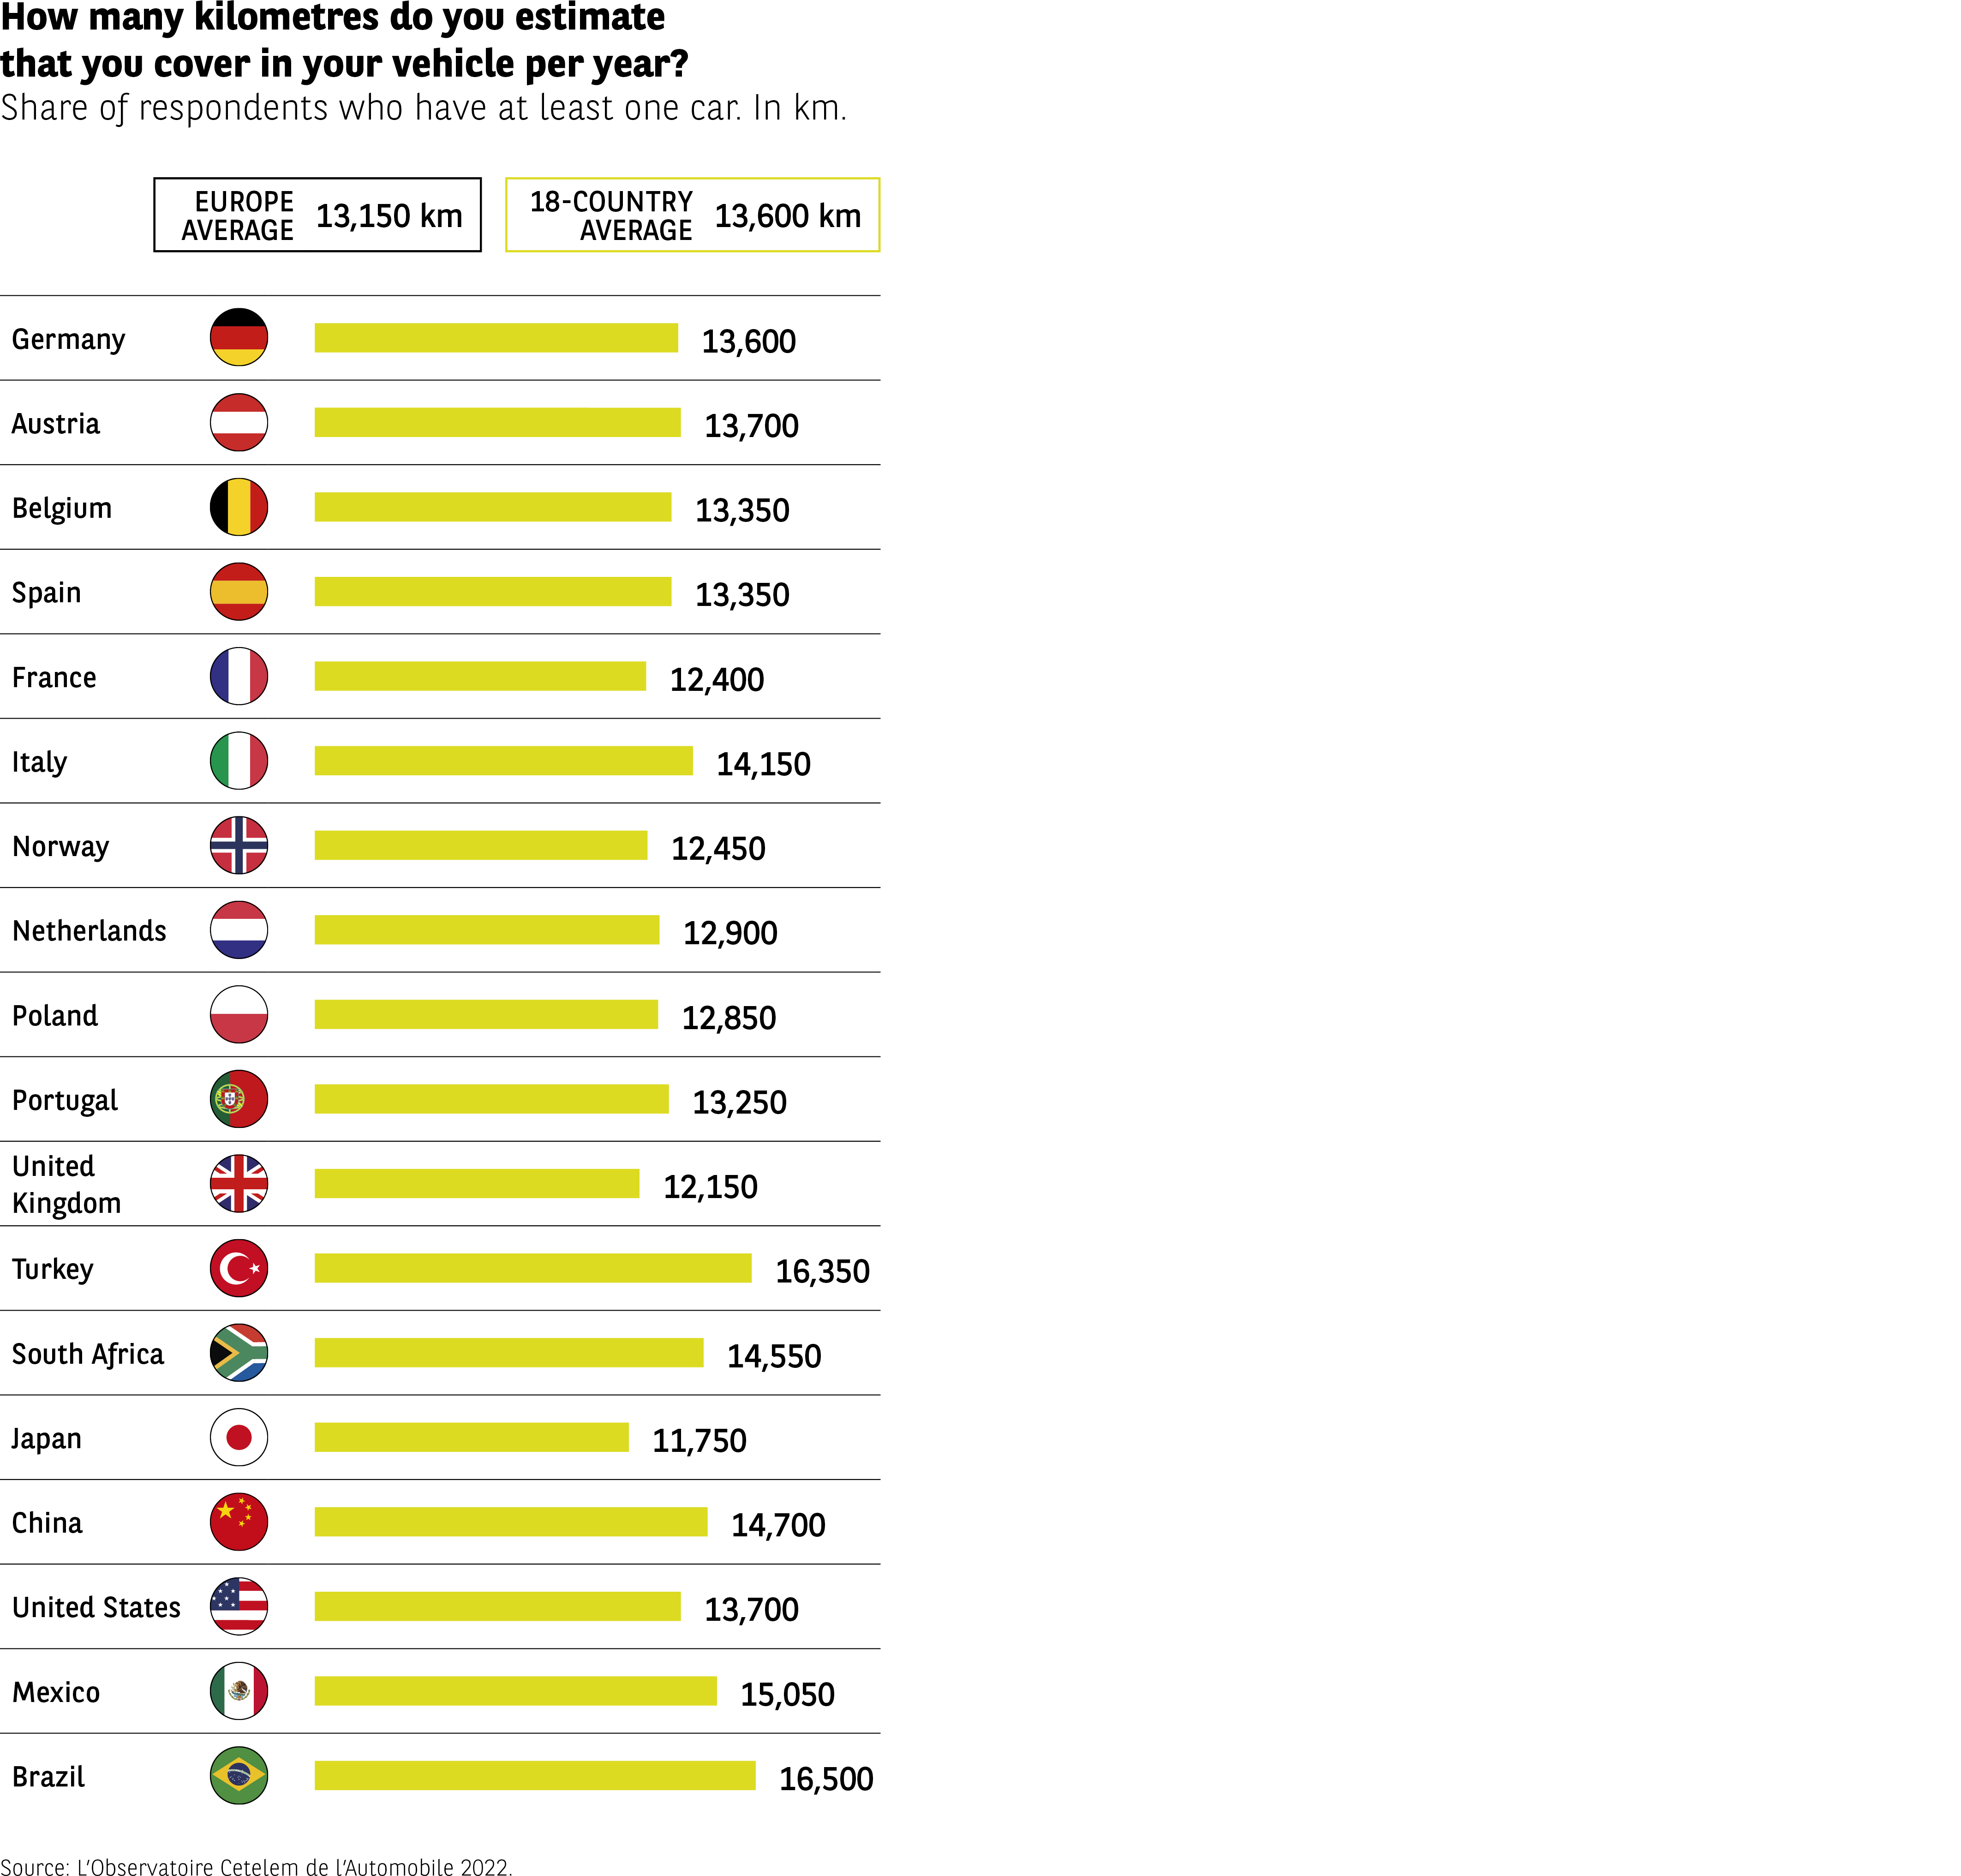 Infographic presenting the number of kilometers that drivers estimate they drive in a year.
Two averages:
– European average: 13,150 km
– Average of 18 countries: 13,600 km
Data by country (km/year):
Germany: 13,600
Austria: 13,700
Belgium: 13,350
Spain: 13,350
France: 12,400
Italy: 14,150
Norway: 12,450
Netherlands: 12,900
Poland: 12,850
Portugal: 13,250
United Kingdom: 12,150
Turkey: 16,350
South Africa: 14,550
Japan: 11,750
China: 14,700
United States: 13,700
Mexico: 15,050
Brazil: 16,500
The highest mileages are observed in Turkey and Brazil. Japan has the lowest value. France is below the European average.
Source: The Cetelem Automotive Observatory 2023.
Infographic presenting the number of kilometers that drivers estimate they drive in a year.
Two averages:
– European average: 13,150 km
– Average of 18 countries: 13,600 km
Data by country (km/year):
Germany: 13,600
Austria: 13,700
Belgium: 13,350
Spain: 13,350
France: 12,400
Italy: 14,150
Norway: 12,450
Netherlands: 12,900
Poland: 12,850
Portugal: 13,250
United Kingdom: 12,150
Turkey: 16,350
South Africa: 14,550
Japan: 11,750
China: 14,700
United States: 13,700
Mexico: 15,050
Brazil: 16,500
The highest mileages are observed in Turkey and Brazil. Japan has the lowest value. France is below the European average.
Source: The Cetelem Automotive Observatory 2023.
The French drive less
As we have just established, the French are not the most avid motorists. The trend over the last 20 years, in terms of the mileage they cover, does nothing to suggest that this will change any time soon. Over this period, the data collected by the SDES (a French data and statistical analysis service) points to a decline that has been further exacerbated by Covid. The average distance travelled in 2020 dipped below the 10,000 km mark, from almost 14,000 km in the early 2000s (Fig 37). The rapid rise of remote working during the pandemic is the crucial factor that explains this significant drop. The next few years will tell us whether this is a temporary blip or a major societal change.
Fig 37 – Evolution of average annual mileage in France
Download this infographic for your presentations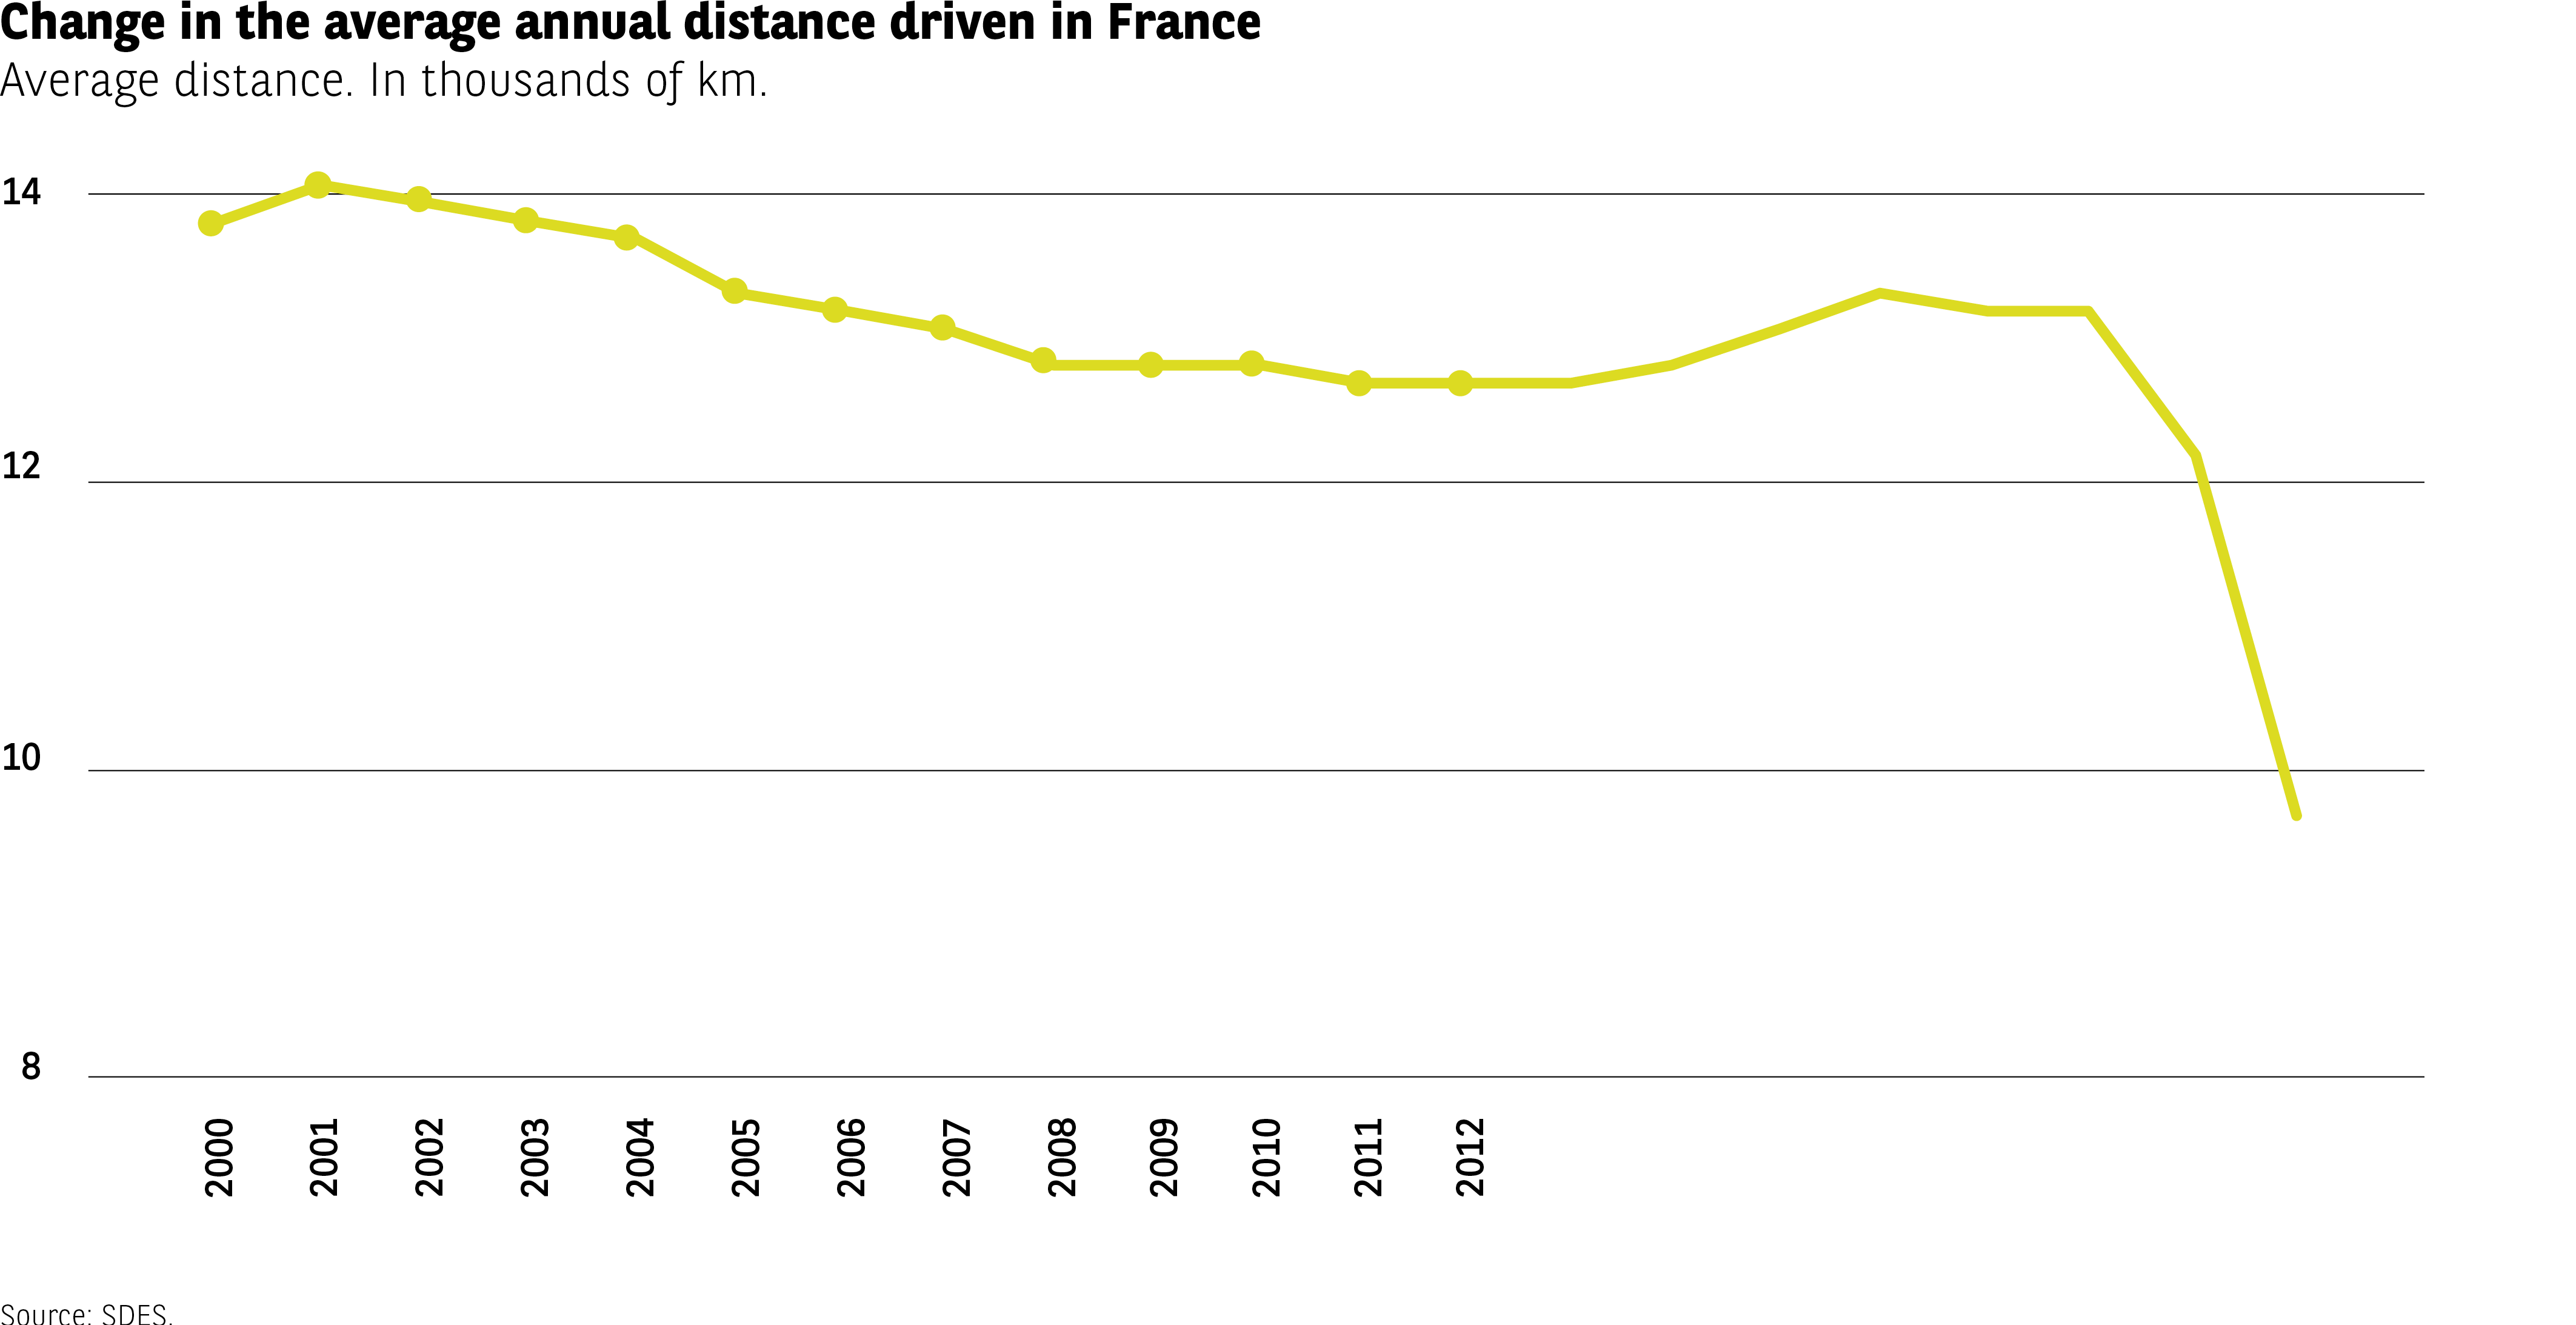 Infographic representing the evolution of average annual mileage of drivers in France between 2000 and 2020.
Data (in thousands of km, visible values):
2000: ≈ 13.8
2001: ≈ 14.1
2002: ≈ 14.0
2003: ≈ 13.9
2004: ≈ 13.8
2005: ≈ 13.6
2006: ≈ 13.3
2007: ≈ 13.2
2008: ≈ 13.0
2009-2016: between 12.3 and 12.7
2017-2018: ≈ 12.9
2019: ≈ 12.3
2020: ≈ 9.7
The average mileage has been decreasing regularly since the beginning of the 2000s, with a marked drop in 2020.
Source: SDES.
Infographic representing the evolution of average annual mileage of drivers in France between 2000 and 2020.
Data (in thousands of km, visible values):
2000: ≈ 13.8
2001: ≈ 14.1
2002: ≈ 14.0
2003: ≈ 13.9
2004: ≈ 13.8
2005: ≈ 13.6
2006: ≈ 13.3
2007: ≈ 13.2
2008: ≈ 13.0
2009-2016: between 12.3 and 12.7
2017-2018: ≈ 12.9
2019: ≈ 12.3
2020: ≈ 9.7
The average mileage has been decreasing regularly since the beginning of the 2000s, with a marked drop in 2020.
Source: SDES.
… for daily journeys cars face a challenge
Soft mobility is gaining ground

The fact that motorists frequently use their cars does not prevent them from sometimes turning to other forms of mobility (Fig 38). Thus, while 4 out of 10 motorists would never give up their car, almost half of those surveyed embrace soft mobility, public transport or train travel alongside motoring. In four of the countries surveyed, a majority of respondents prefer to use their car: the UK, Germany, France and, most fervently, the USA. Meanwhile, China, Turkey and Japan are where we find the highest proportions of motorists who use soft mobility solutions or public transport. Carsharing and ridesharing still only appeal to a relatively small percentage of motorists (11%). Less economically developed countries seem to be the keenest on these modes of transport, probably because it is common for people there to travel in mini-buses or family cars that are used in a similar way.
Fig 38 – Preferred modes of transportation (excluding car) for daily commutes
Download this infographic for your presentations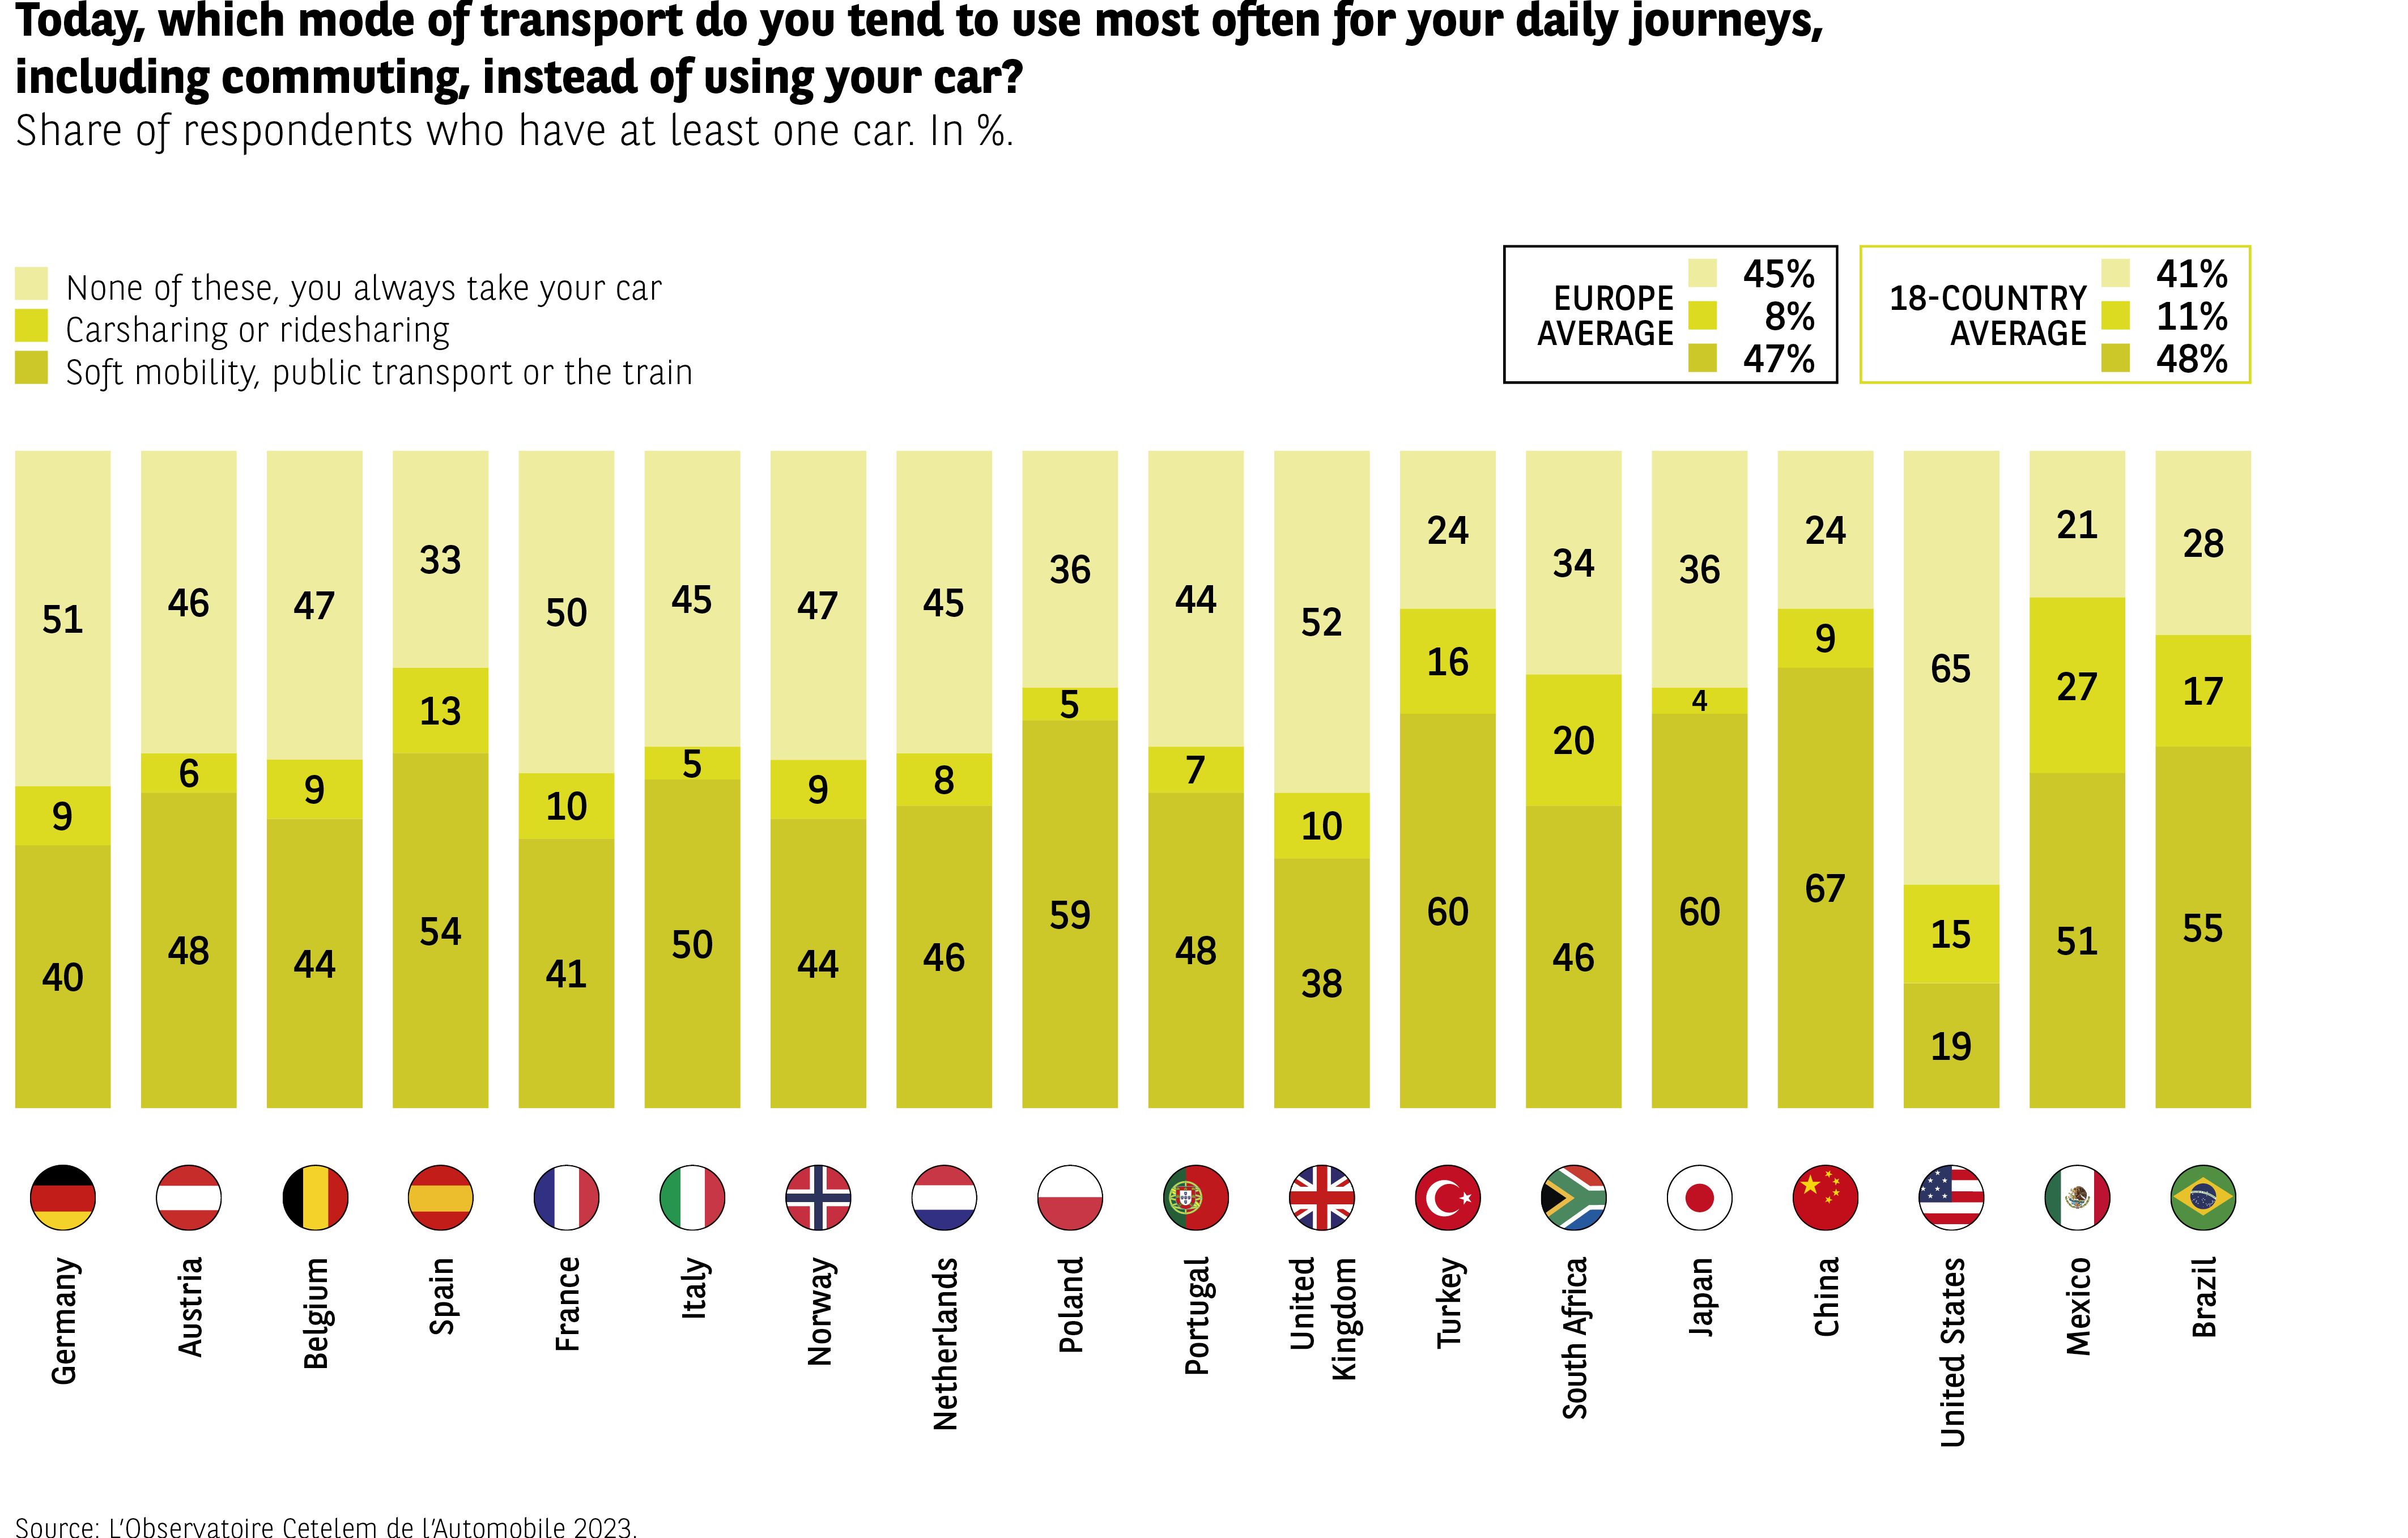 Infographic showing the modes used when a driver does not take their car for daily commutes, divided into 3 categories:
– systematic car use,
– carpooling or ride-sharing,
– soft mobility, public transportation, or train.
Data (Car / Carpooling-ride-sharing / Soft mobility):
Germany: 51 / 9 / 40
Austria: 46 / 6 / 48
Belgium: 47 / 6 / 44
Spain: 33 / 13 / 54
France: 50 / 10 / 41
Italy: 45 / 5 / 50
Norway: 47 / 9 / 44
Netherlands: 45 / 8 / 46
Poland: 36 / 5 / 59
Portugal: 44 / 7 / 48
United Kingdom: 52 / 10 / 38
Turkey: 24 / 16 / 60
South Africa: 34 / 20 / 46
Japan: 36 / 4 / 60
China: 24 / 9 / 67
United States: 36 / 15 / 49
Mexico: 21 / 27 / 51
Brazil: 28 / 17 / 55
Averages:
– Europe: 45 / 8 / 47
– 18 countries: 41 / 11 / 48
Soft mobility dominates in several European and Asian countries, particularly China and Japan. Carpooling remains low except in the United States and Mexico. Systematic car use remains dominant in many European countries.
Source: The Cetelem Automotive Observatory 2023.
Infographic showing the modes used when a driver does not take their car for daily commutes, divided into 3 categories:
– systematic car use,
– carpooling or ride-sharing,
– soft mobility, public transportation, or train.
Data (Car / Carpooling-ride-sharing / Soft mobility):
Germany: 51 / 9 / 40
Austria: 46 / 6 / 48
Belgium: 47 / 6 / 44
Spain: 33 / 13 / 54
France: 50 / 10 / 41
Italy: 45 / 5 / 50
Norway: 47 / 9 / 44
Netherlands: 45 / 8 / 46
Poland: 36 / 5 / 59
Portugal: 44 / 7 / 48
United Kingdom: 52 / 10 / 38
Turkey: 24 / 16 / 60
South Africa: 34 / 20 / 46
Japan: 36 / 4 / 60
China: 24 / 9 / 67
United States: 36 / 15 / 49
Mexico: 21 / 27 / 51
Brazil: 28 / 17 / 55
Averages:
– Europe: 45 / 8 / 47
– 18 countries: 41 / 11 / 48
Soft mobility dominates in several European and Asian countries, particularly China and Japan. Carpooling remains low except in the United States and Mexico. Systematic car use remains dominant in many European countries.
Source: The Cetelem Automotive Observatory 2023.
These overall results conceal a clear divide between rural and urban areas. 56% of those who live in the country invariably use their cars on a daily basis, compared with only 35% of city dwellers. In France, the ratio is almost 2:1 (64% vs. 36%).
Conversely, more than half of all urbanites opt for soft mobility, public transport or trains, with the figure for rural populations reaching just 35%.
We will examine this territorial divide in more detail later on.
An even balance when it comes to leisure and holiday use
The results for private journeys and leisure travel are no great departure from the previous figures (Fig 39). The scores are more or less the same, with 42% always using their car and 44% opting for soft mobility, public transport or the train. From one country to the next, the balance is practically identical.
Fig 39 – Preferred modes of transportation (excluding car) for private trips
Download this infographic for your presentations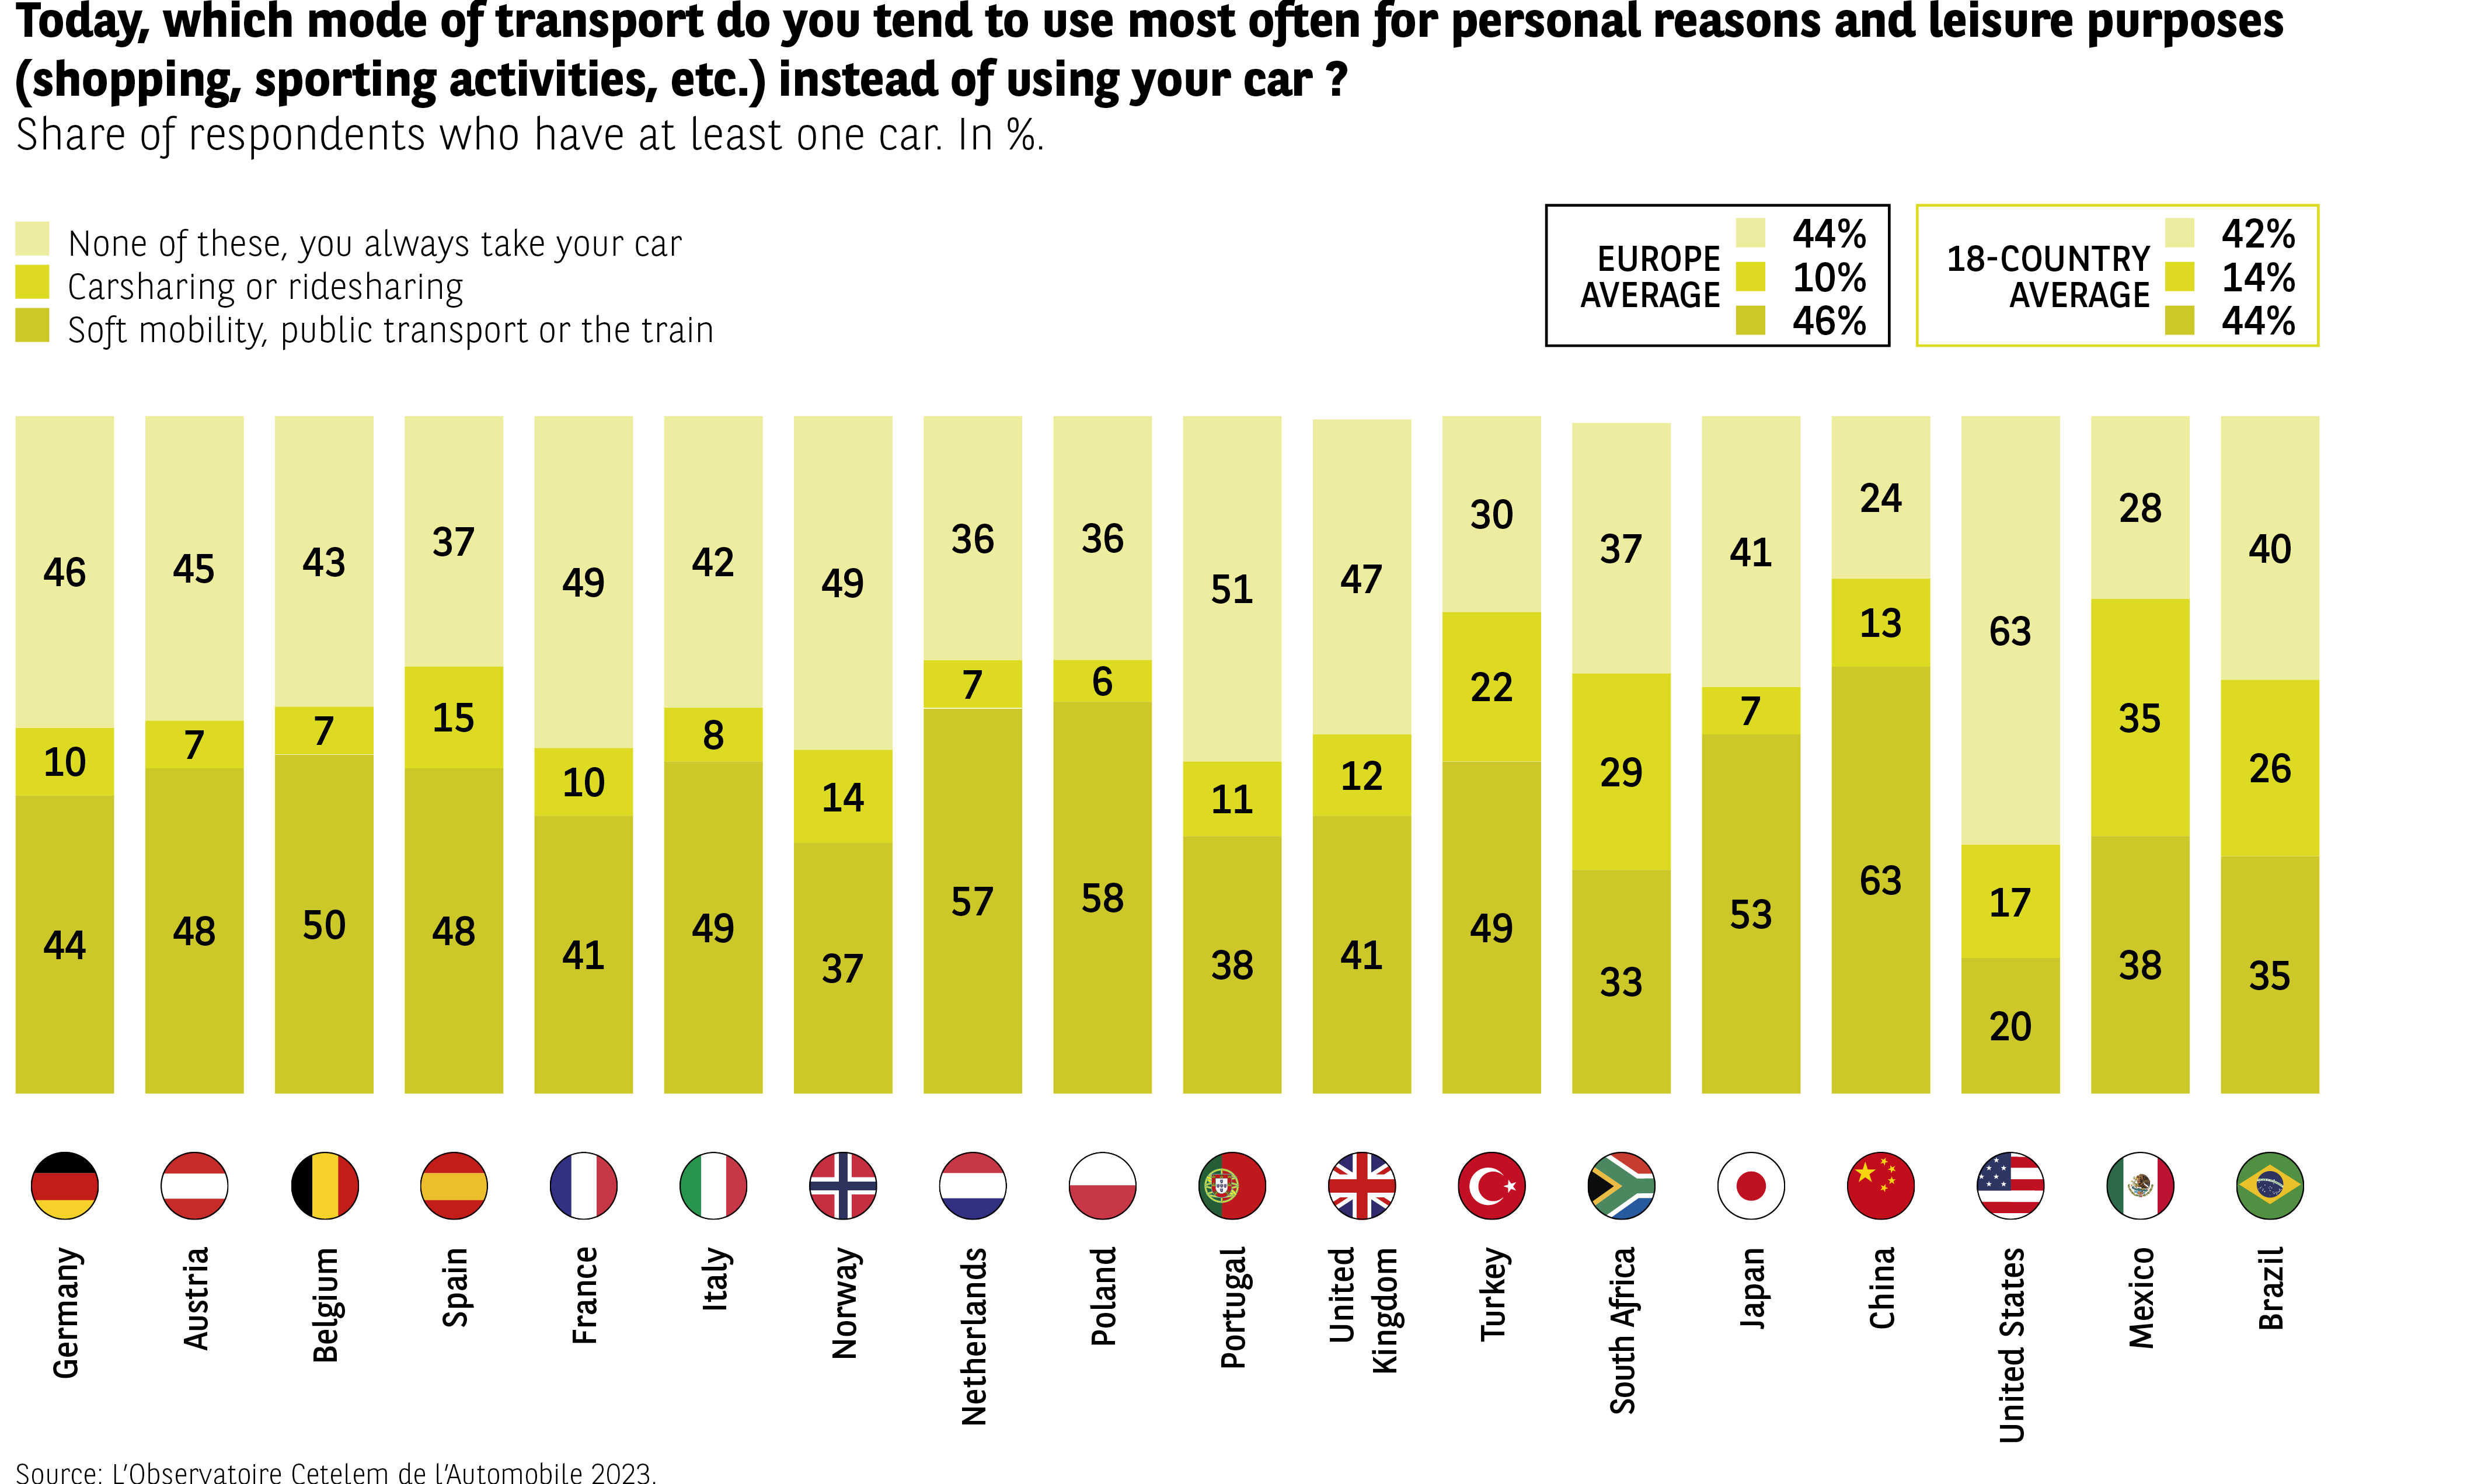 The infographic presents the mobility modes chosen by people who own at least one car when they do not use their vehicle for private or leisure trips. Results are expressed as percentages across three categories: none of these, you systematically use your car, car-sharing or ride-sharing, and soft mobility, public transport or train.
The readable values are:
Germany: 44 %, 10 %, 46 %
Austria: 48 %, 7 %, 45 %
Belgium: 50 %, 7 %, 43 %
Spain: 48 %, 15 %, 37 %
France: 41 %, 10 %, 49 %
Italy: 49 %, 8 %, 42 %
Norway: 37 %, 14 %, 49 %
Netherlands: 57 %, 7 %, 36 %
Poland: 58 %, 6 %, 36 %
Portugal: 38 %, 11 %, 51 %
United Kingdom: 41 %, 12 %, 47 %
Turkey: 49 %, 22 %, 30 %
South Africa: 33 %, 29 %, 37 %
Japan: 53 %, 7 %, 41 %
China: 63 %, 13 %, 24 %
United States: 38 %, 20 %, 41 %
Mexico: 35 %, 38 %, 28 %
Brazil: 35 %, 26 %, 40 %
A summary box indicates the averages:
– Europe average: 44 %, 10 %, 46 %
– 18-country average: 42 %, 14 %, 44 %
Overall, the data reveals wide contrasts: some countries frequently use soft mobility options (Portugal, France), while others rely heavily on the car (China, Japan). Car-sharing remains a minority choice in most countries, with higher levels in Mexico and Turkey.
Source: Observatoire Cetelem de l’Automobile 2023.
The infographic presents the mobility modes chosen by people who own at least one car when they do not use their vehicle for private or leisure trips. Results are expressed as percentages across three categories: none of these, you systematically use your car, car-sharing or ride-sharing, and soft mobility, public transport or train.
The readable values are:
Germany: 44 %, 10 %, 46 %
Austria: 48 %, 7 %, 45 %
Belgium: 50 %, 7 %, 43 %
Spain: 48 %, 15 %, 37 %
France: 41 %, 10 %, 49 %
Italy: 49 %, 8 %, 42 %
Norway: 37 %, 14 %, 49 %
Netherlands: 57 %, 7 %, 36 %
Poland: 58 %, 6 %, 36 %
Portugal: 38 %, 11 %, 51 %
United Kingdom: 41 %, 12 %, 47 %
Turkey: 49 %, 22 %, 30 %
South Africa: 33 %, 29 %, 37 %
Japan: 53 %, 7 %, 41 %
China: 63 %, 13 %, 24 %
United States: 38 %, 20 %, 41 %
Mexico: 35 %, 38 %, 28 %
Brazil: 35 %, 26 %, 40 %
A summary box indicates the averages:
– Europe average: 44 %, 10 %, 46 %
– 18-country average: 42 %, 14 %, 44 %
Overall, the data reveals wide contrasts: some countries frequently use soft mobility options (Portugal, France), while others rely heavily on the car (China, Japan). Car-sharing remains a minority choice in most countries, with higher levels in Mexico and Turkey.
Source: Observatoire Cetelem de l’Automobile 2023.
Do weekend trips or holidays move the needle? Not really. Here again, 4 out of 10 people invariably use their car for these purposes. For long distances, trains and coaches appear to be serious competitors of the automobile (Fig 40).
Fig 40 – Preferred modes of transportation (excluding car) for occasional trips
Download this infographic for your presentations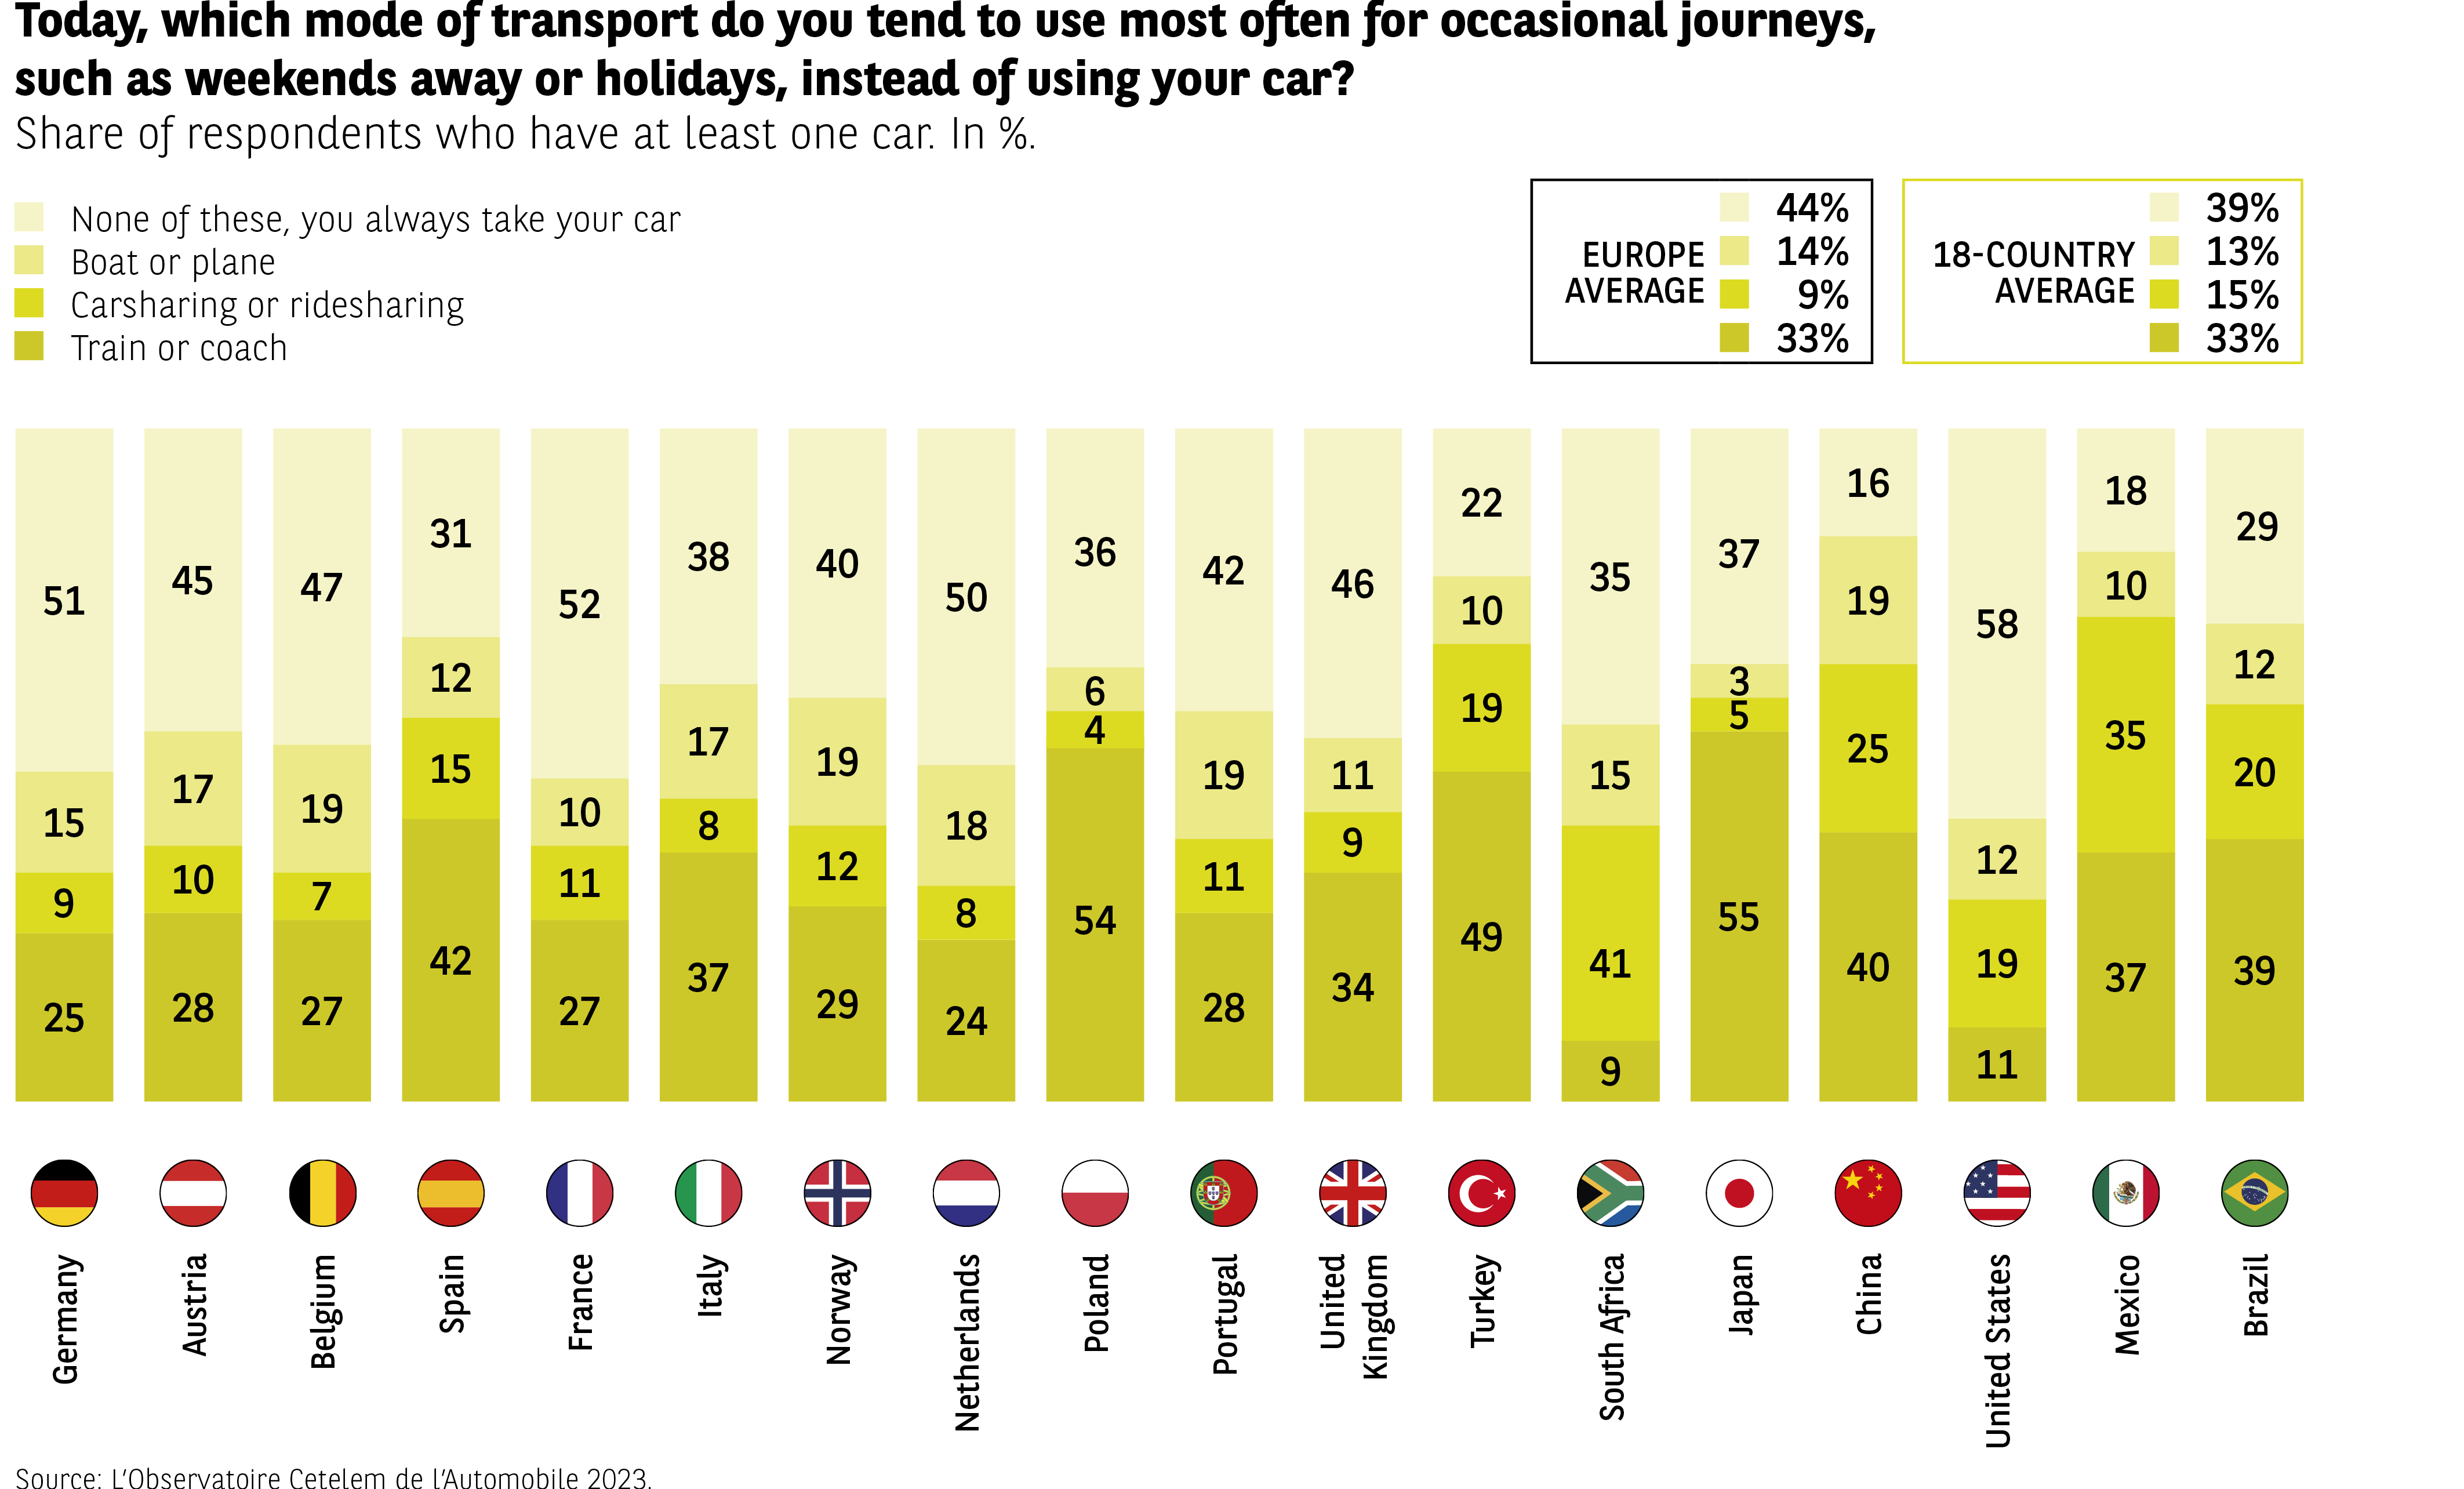 Infographic comparing the modes of transportation used when drivers do not take their car for occasional trips, such as weekends or vacations.
Data (Systematic car use / Boat-plane / Carpooling-ride-sharing / Train-car):
Germany: 51 / 15 / 9 / 25
Austria: 45 / 17 / 10 / 28
Belgium: 47 / 19 / 7 / 27
Spain: 31 / 12 / 15 / 42
France: 52 / 10 / 11 / 27
Italy: 38 / 8 / 17 / 37
Norway: 40 / 19 / 12 / 29
Netherlands: 50 / 18 / 8 / 24
Poland: 36 / 6 / 4 / 54
Portugal: 42 / 19 / 11 / 28
United Kingdom: 46 / 11 / 9 / 34
Turkey: 22 / 10 / 19 / 49
South Africa: 35 / 15 / 15 / 41
Japan: 37 / 3 / 5 / 55
China: 16 / 19 / 25 / 40
United States: 58 / 10 / 12 / 19
Mexico: 18 / 12 / 20 / 37
Brazil: 29 / 10 / 12 / 39
Averages:
– Europe: 44 / 14 / 9 / 33
– 18 countries: 39 / 13 / 15 / 33
The car remains dominant in most countries, but some stand out for their significant use of trains or cars (Japan, Poland). Non-European countries show more variability in the shares of other modes.
Source: The Cetelem Automotive Observatory 2023.
Infographic comparing the modes of transportation used when drivers do not take their car for occasional trips, such as weekends or vacations.
Data (Systematic car use / Boat-plane / Carpooling-ride-sharing / Train-car):
Germany: 51 / 15 / 9 / 25
Austria: 45 / 17 / 10 / 28
Belgium: 47 / 19 / 7 / 27
Spain: 31 / 12 / 15 / 42
France: 52 / 10 / 11 / 27
Italy: 38 / 8 / 17 / 37
Norway: 40 / 19 / 12 / 29
Netherlands: 50 / 18 / 8 / 24
Poland: 36 / 6 / 4 / 54
Portugal: 42 / 19 / 11 / 28
United Kingdom: 46 / 11 / 9 / 34
Turkey: 22 / 10 / 19 / 49
South Africa: 35 / 15 / 15 / 41
Japan: 37 / 3 / 5 / 55
China: 16 / 19 / 25 / 40
United States: 58 / 10 / 12 / 19
Mexico: 18 / 12 / 20 / 37
Brazil: 29 / 10 / 12 / 39
Averages:
– Europe: 44 / 14 / 9 / 33
– 18 countries: 39 / 13 / 15 / 33
The car remains dominant in most countries, but some stand out for their significant use of trains or cars (Japan, Poland). Non-European countries show more variability in the shares of other modes.
Source: The Cetelem Automotive Observatory 2023.